Bond Yields Explained Simply for Beginners
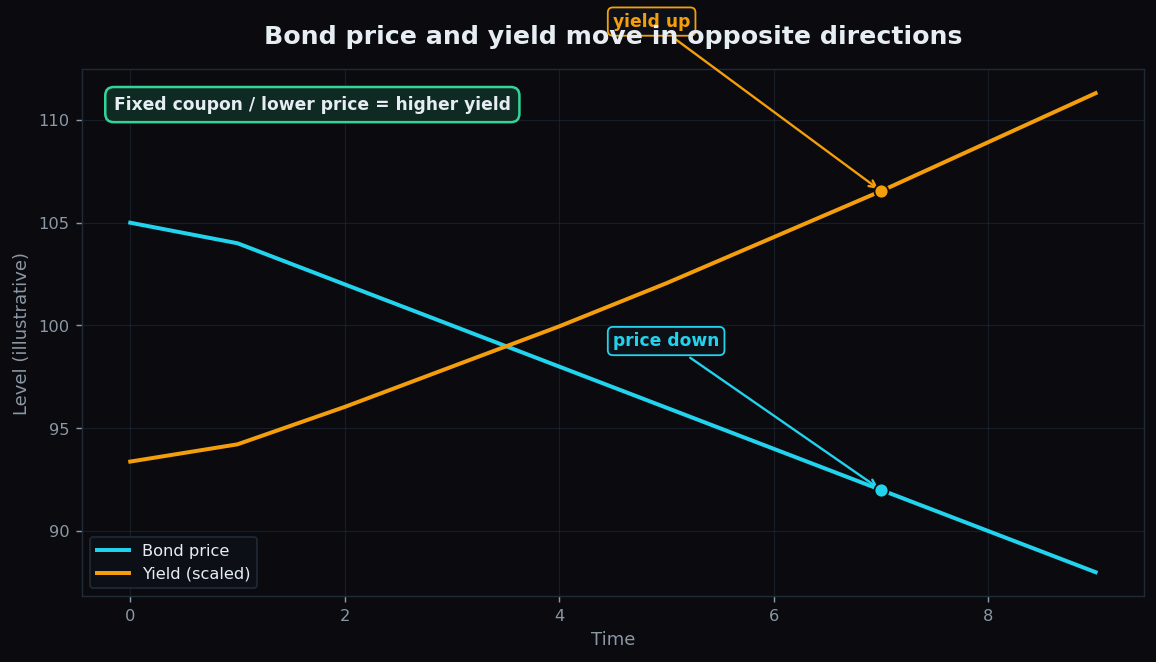
You will hear it on every business channel: "the ten-year yield ticked up today, and equities wobbled." For a beginner, bond yields can sound like insider jargon. They are not. A yield is simply the return a bond pays, and once you see how price and yield behave like a see-saw, a huge amount of market news suddenly makes sense. This post builds the idea from scratch.
What a bond is, in one paragraph
A bond is a loan you make to a borrower — usually a government or a large company — that pays you fixed interest and returns your money on a set date. The fixed interest amount is called the coupon. The date you get your money back is maturity, and the original loan amount is the face value (often 1,000). Buy a bond, and you are the lender collecting interest.
What "yield" means
The yield is the return that bond gives you, expressed as a percentage of what you pay for it. The cleanest version to start with is simple: yield is the annual coupon divided by the price you pay.
Here is the crucial fact that trips up every beginner: the coupon is fixed, but the price of a bond changes every day as it trades in the market. And because the coupon is locked, the price is the only thing that can move to make the bond more or less attractive. That single fact drives everything below.
The see-saw: price and yield move in opposite directions
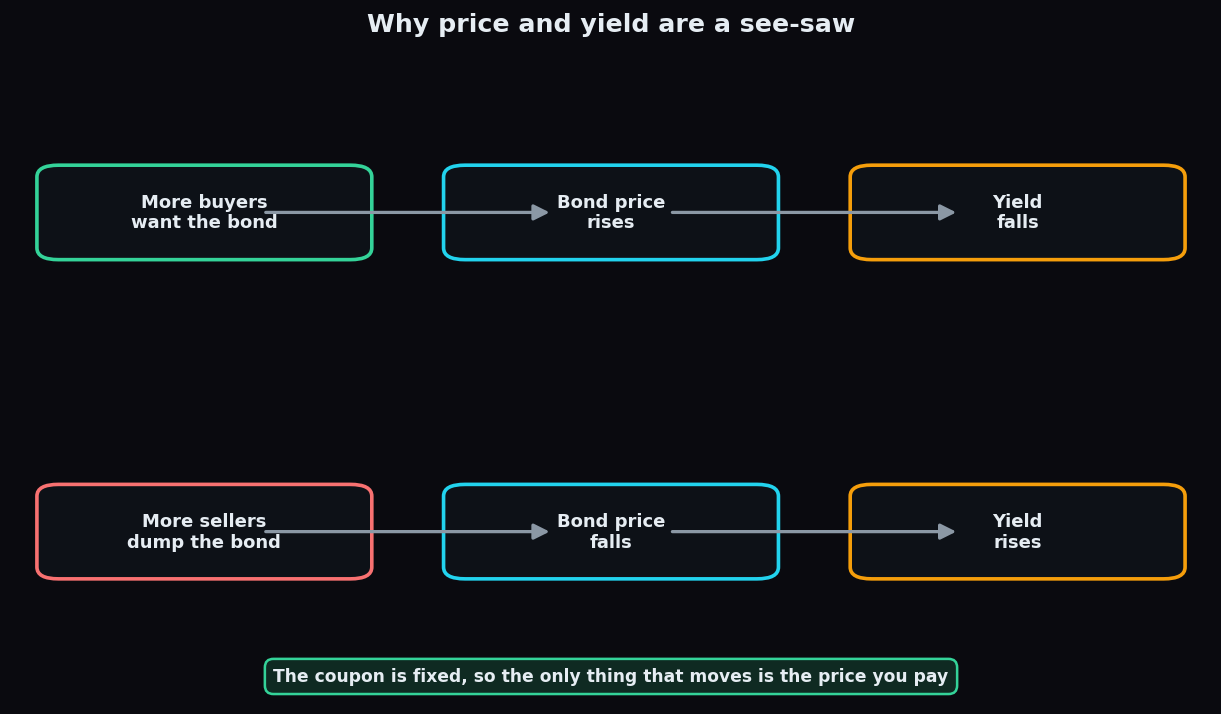
Picture a bond with a fixed coupon of 50 rupees a year on a face value of 1,000. If you buy it at 1,000, your yield is 50 / 1,000 = 5%. Now suppose demand cools and the price falls to 900. The coupon is still 50 — it never changes — so your yield is now 50 / 900, which is about 5.6%. The price fell and the yield rose.
Flip it around. If buyers rush in and push the price up to 1,100, the yield becomes 50 / 1,100, or about 4.5%. The price rose and the yield fell. This inverse relationship is the heart of the entire bond market.
Think of a see-saw on a playground. Price sits on one end, yield on the other. Push one down and the other rises. They are mechanically tied together because the coupon in the middle is a fixed weight.
Why the 10-year yield gets all the attention
Bonds exist across many maturities — some mature in months, others in decades. The one the whole market watches is the 10-year government bond yield. In the United States it is the 10-year Treasury; in India it is the 10-year government security. A few reasons it earns the spotlight:
- It is a benchmark for the price of money. Loans, mortgages, and corporate borrowing costs are often set relative to the 10-year yield. When it rises, borrowing gets costlier across the economy.
- It reflects expectations. A ten-year horizon bundles the market's collective view on future growth, inflation, and central-bank policy into one number.
- It competes with stocks. A safe government bond paying a higher yield becomes a more tempting alternative to riskier shares. When yields rise sharply, money can rotate out of equities toward bonds — which is why stock indices often flinch when yields jump.
How investors actually read yields
Two habits are worth knowing. First, the direction of the move often matters more than the level. A yield drifting from 7.0% to 7.1% is routine; a fast jump from 7.0% to 7.5% signals a genuine shift in expectations and gets attention.
Second, market watchers compare yields across maturities — the yield curve, which plots yields from short to long maturities. Normally longer bonds yield more, because lending for longer carries more uncertainty. When that ordering flips and short-term yields exceed long-term ones — an inverted curve — it is widely read as a caution signal about the economy. It is a description of sentiment, not a guarantee of what follows.
The honest catch
Yields are powerful context, but they are not a crystal ball. A few caveats:
- The stock reaction is not automatic. Rising yields sometimes accompany rising stocks, when they reflect strong growth rather than inflation fear. Context decides.
- Real yields matter too. A yield of 7% means little without knowing inflation. Subtract inflation and you get the real yield — the return in actual buying power.
- Many forces move yields at once. Central-bank policy, government borrowing, foreign flows, and global rates all tug on them simultaneously.
- The simple coupon-over-price formula is a starting point. Professional yield-to-maturity math also accounts for the gain or loss between price and face value at maturity. The see-saw logic still holds.
You do not need the advanced math to benefit. If you remember only one thing, remember the see-saw: when you hear "yields rose," you can immediately translate it to "bond prices fell," and you will understand more market commentary than most beginners ever do.
Yields, inflation, and global rates all feed the same market you trade every day. TrueTrend turns that web of context into clear, beginner-friendly structure. Start free with TrueTrend and keep building your market literacy.
Key takeaways
- A bond is a loan that pays a fixed coupon; its yield is the return as a percentage of the price you pay.
- Because the coupon is fixed, price and yield move in opposite directions — the see-saw at the core of the bond market.
- A 50-coupon bond yields 5% at a price of 1,000, about 5.6% at 900, and about 4.5% at 1,100.
- The 10-year yield is watched as a benchmark for borrowing costs and a competitor to stocks.
- Direction often matters more than level, and an inverted yield curve is read as a caution signal — descriptively, not as a promise.
- Yields are context, not prediction; real yields and the wider backdrop always matter.
See these concepts on live market data — free
Create a free TrueTrend account to watch daily support/resistance levels, market regime, and option-positioning charts on NIFTY, BankNifty and 12 more instruments. Every level we publish is scored on a public scoreboard — misses included. No card required.
Free forever tier · daily levels with published hit-rates across every instrument. Descriptive market structure, not investment advice.
Not ready for an account? Get the daily levels by email.
One short email each market day — the indices' call wall, put wall, gamma flip and max pain, and how the last session's levels scored. Free, no account, unsubscribe anytime.
Descriptive market structure, not investment advice. We never share your email.