The Bull Call Spread Explained (Illustrative Example)
A bull call spread is a way to express a mildly positive view on a stock while spending less and risking a fixed, known amount. You buy one call at a lower strike and, at the same time, sell another call at a higher strike. The sold call helps pay for the bought call, so the whole position is cheaper — but it also caps how much you can make. This article walks through the mechanics with round numbers. It is an illustrative example to explain how the structure works — not a recommendation, and not a trade to place.
What a bull call spread actually is
Recall that a call option gives its buyer the right to buy a stock at a fixed price (the strike) before expiry, in exchange for an upfront premium. A single bought call profits when the stock rises, but it can be expensive, and its whole premium can be lost if the stock goes nowhere.
A bull call spread combines two calls of the same expiry:
- Buy a call at a lower strike (this is your main bullish bet).
- Sell a call at a higher strike (this brings in premium to offset the cost).
The net cost you pay upfront is called the net debit. Because the sold call reduces that cost, the spread is cheaper than buying the call alone — but selling it means you have promised to give up any gains above the higher strike. You have traded away the far upside in return for a lower entry price and a smaller maximum loss.
Think of it as buying a concert ticket and immediately pre-selling your seat to a friend at a higher price if the show sells out. Your outlay drops because your friend chipped in. But if the resale market goes crazy, you do not benefit — you have already locked in the price at which you hand the seat over.
A worked example with round numbers
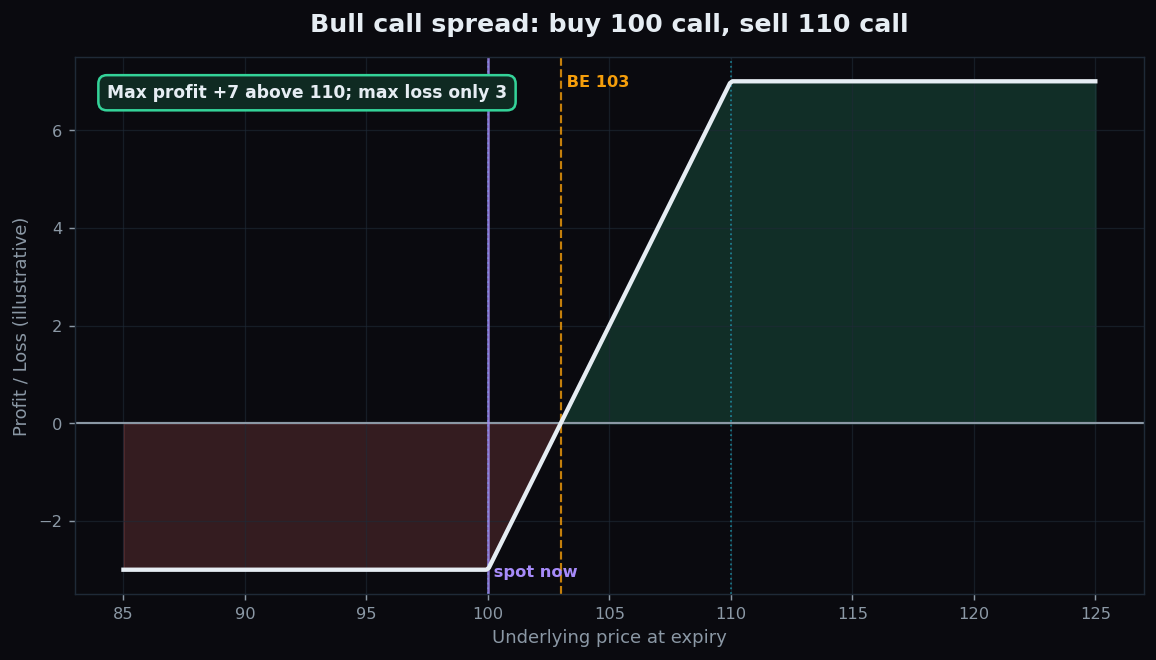
Say a stock trades at 100. You buy the 100 call for a premium of 5, and you sell the 110 call for a premium of 2. Your net cost is 5 minus 2, a net debit of 3. At expiry:
- Stock at 95 (or anywhere below 100). Both calls expire worthless. You lose your entire net debit of 3 — that is your maximum loss, and it is known from day one.
- Stock at 103. The 100 call is worth 3, the 110 call is worthless. You recover your 3 cost exactly — this is the breakeven.
- Stock at 110 or above, say 120. The 100 call you own is worth 20, but the 110 call you sold is worth 10 against you. The two net to 10, minus your 3 cost, for a maximum profit of 7. Notice it does not matter whether the stock is at 110 or 200 — your profit is capped at 7.
So: maximum loss 3, maximum profit 7, breakeven 103. Both the best case and the worst case are fixed and knowable before you ever enter. That defined-risk, defined-reward shape is the whole appeal.
Why people study it
The bull call spread is a classic lesson in paying for what you actually expect. If your view is “this stock might drift up modestly, not explode,” then paying full price for unlimited upside is wasteful — you are buying potential you do not expect to use. Selling the higher call recovers some of that cost. You give up a tail you did not believe in anyway.
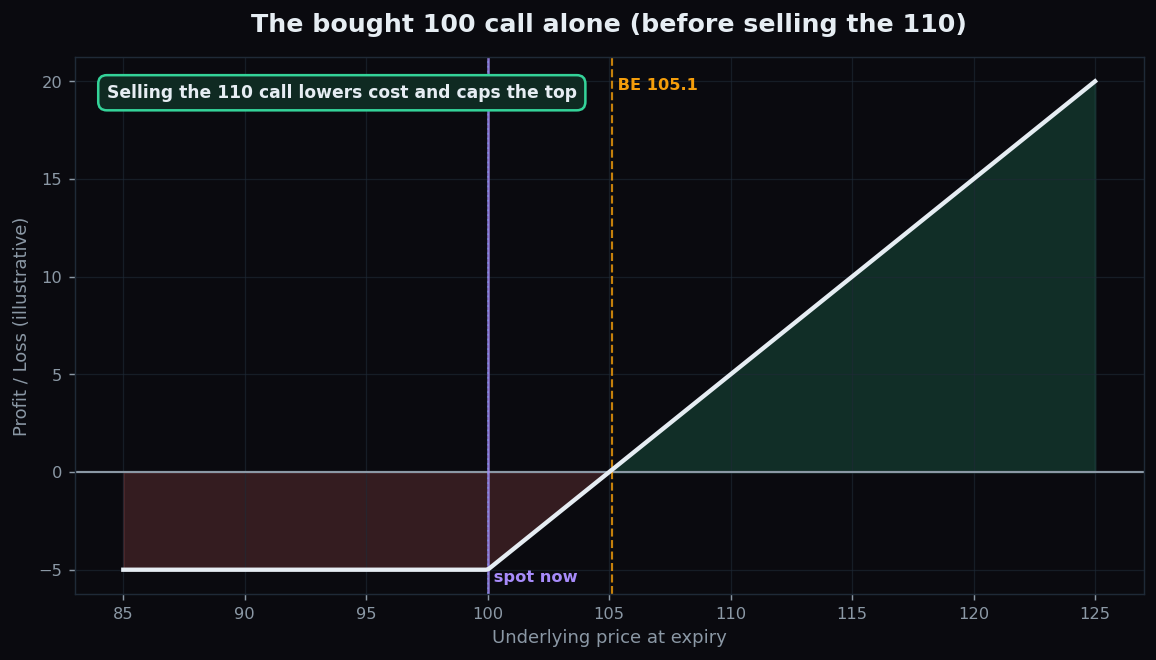
It also caps the loss to a small, defined number, which makes position sizing simple: you can never lose more than the net debit. The two charts show the difference. The first is the finished spread. The second shows the bought 100 call on its own — more expensive, with an open-ended top that the spread deliberately trims away.
The honest catch: what can go wrong
The defined shape hides some real limitations worth naming plainly:
- Your profit is capped. If the stock rockets to 150, you still only make 7. The whole design gives away the big move. If a large jump was your actual thesis, a spread fights against you.
- You can still lose the full debit. If the stock stays flat or falls, you lose all 3. “Defined risk” does not mean “low chance of loss.”
- Timing matters twice. The stock must rise and do it before expiry. Time decay works against a net-debit spread as the clock runs down.
- Two legs, two sets of costs. You pay bid-ask spreads and charges on both options, which quietly erodes a strategy whose maximum profit is already small.
The gap between the two strikes also shapes the trade. A wider gap (say 100 and 120) raises the possible profit but usually costs more debit; a narrow gap is cheaper but caps the reward sooner. Choosing that width is the core decision.
Structures like this only make sense once you can read where a stock is priced to go and where option interest is stacked. TrueTrend turns raw derivatives data into plain-English market structure. Explore TrueTrend free and build the context first.
Key takeaways
- A bull call spread buys a lower-strike call and sells a higher-strike call of the same expiry.
- In the example: buy the 100 call for 5, sell the 110 call for 2 → net debit 3, max loss 3, max profit 7, breakeven 103.
- It lowers cost and caps risk, but also caps the reward — you give up the big move on purpose.
- The catch: profit is capped, the full debit can still be lost, and timing plus two-leg costs both work against you.
- This is an educational illustration of the mechanics, with made-up numbers — not advice and not a trade to place.
See these concepts on live market data — free
Create a free TrueTrend account to watch daily support/resistance levels, market regime, and option-positioning charts on NIFTY, BankNifty and 12 more instruments. Every level we publish is scored on a public scoreboard — misses included. No card required.
Free forever tier · daily levels with published hit-rates across every instrument. Descriptive market structure, not investment advice.
Not ready for an account? Get the daily levels by email.
One short email each market day — the indices' call wall, put wall, gamma flip and max pain, and how the last session's levels scored. Free, no account, unsubscribe anytime.
Descriptive market structure, not investment advice. We never share your email.