Circuit Breakers and Price Bands Explained Simply
Every now and then a stock you are watching simply stops moving. The price is stuck at a number, orders pile up, and nothing trades. Or the whole market freezes for a few minutes in the middle of a crash. This is not a glitch and not a conspiracy. It is a deliberate safety brake called a circuit breaker, working exactly as designed. Understanding these brakes turns a scary, confusing moment into something you can read calmly. Let us take them apart.
What a price band is
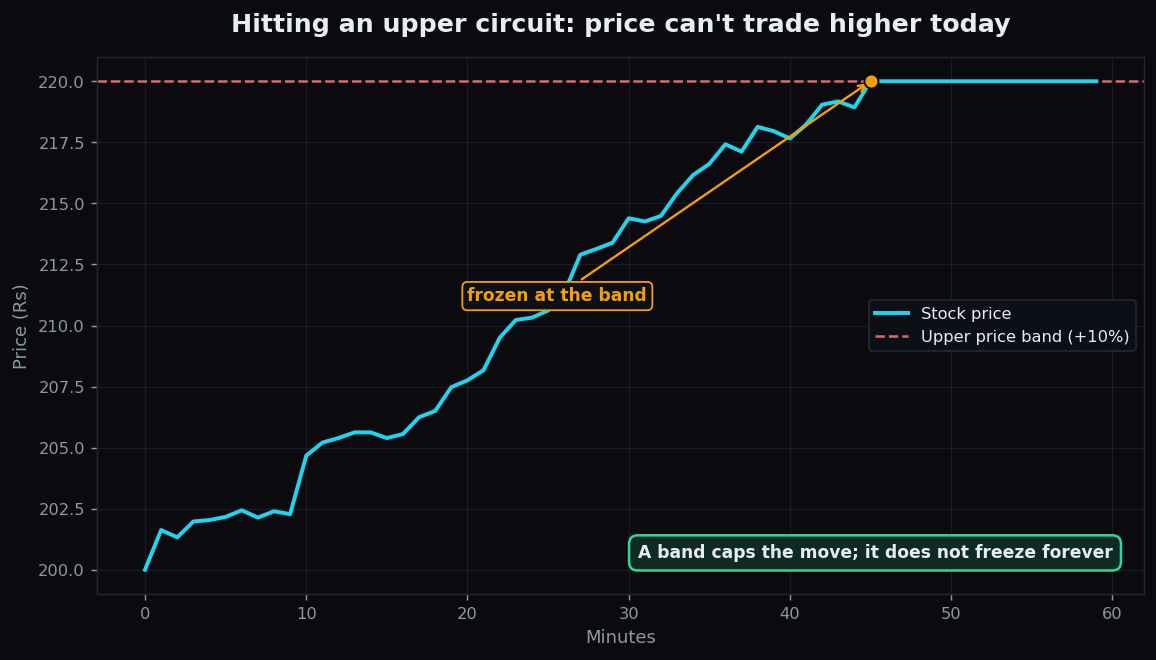
A price band (also called a circuit limit) is the maximum a single stock is allowed to move in one trading day, measured from a reference price — usually the previous day’s close. Picture a band of, say, 10%. If a share closed at 200 rupees yesterday, a 10% band lets it trade today only between 180 and 220. The 220 ceiling is the upper circuit; the 180 floor is the lower circuit.
Think of it like a speed limit on a road. The car can still move, but not faster than the posted limit. The band does not decide direction or fairness — it just caps how far the price can travel in one session.
In the chart above, the stock climbs all morning and then flattens dead against the upper band. Once it touches 220, no trade can print higher today. Buyers may still be eager, but the rules will not let a trade happen above the ceiling, so the price simply sits there.
What “hitting the circuit” feels like
When a stock is “locked” at its upper circuit, demand far outweighs supply. Loads of buyers want in at 220, but almost no one is willing to sell — everyone holding expects more tomorrow. With buyers stacked and sellers absent, no trade clears, and the price is frozen at the ceiling. The mirror image is a lower circuit: a flood of sellers, no buyers, and the price pinned to the floor.
A worked example. A small company announces surprise good news before the open. Buyers swarm; the share jumps to its 10% upper band almost instantly and locks there. If you wanted to buy, you join a long queue and may not get filled at all. If you wanted to sell, you are in luck — sellers are scarce, so your order clears easily. A locked circuit is the market shouting that one side of the order book has completely overwhelmed the other.
Why bands exist at all
Price bands exist to slow down panic and stop errors from snowballing. Three concrete jobs:
- Cooling-off. A forced ceiling or floor gives traders a beat to breathe instead of chasing a runaway price into a frenzy.
- Catching mistakes. A “fat-finger” typo — an order for the wrong quantity or price — can’t send a stock to zero or the moon in seconds if a band caps the move.
- Protecting the small participant. Bands keep a single dramatic minute from wiping out people who simply could not react fast enough.
Importantly, a band is a pause, not a ban. Hitting a circuit today does not stop the stock from moving again tomorrow from a new reference price. A stock can move limit-up several days in a row, each day from a fresh base. The brake controls the speed, never the final destination.
Market-wide circuit breakers
Individual stocks have their own bands, but there is a bigger brake for the whole market. A market-wide circuit breaker halts all trading when a benchmark index falls by large, pre-set amounts in a single day. These are the brakes that occasionally pause an entire exchange during a crash.
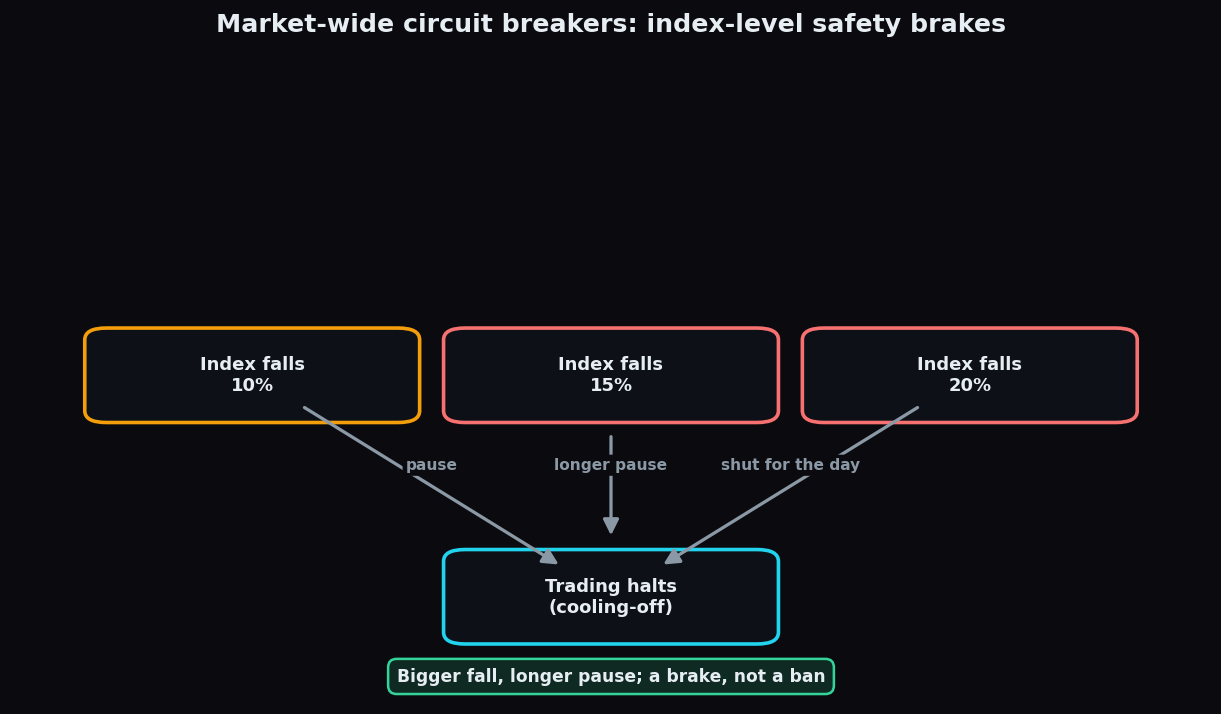
The structure is tiered, as the diagram shows. Using round, illustrative thresholds: a 10% fall in the index triggers a short halt; a 15% fall triggers a longer one; a 20% fall can stop trading for the rest of the day. The deeper the plunge, the longer the cool-down. The exact percentages and pause lengths are set by the regulator and exchanges and depend on the time of day, but the principle is universal — bigger fall, longer pause.
The point of a market-wide halt is not to prevent losses; prices may well fall further when trading resumes. The point is to interrupt a feedback loop, where falling prices trigger forced selling, which drives prices lower still. A few minutes of enforced stillness lets information spread and lets both sides reassess, so the reopening is a little less chaotic.
How a beginner should read them
- A locked stock is a message. An upper circuit screams overwhelming demand; a lower circuit screams overwhelming supply.
- Frozen does not mean broken. Your app is fine; the rules are simply doing their job.
- You may not get filled. On the crowded side of a locked circuit, your order can sit in a long queue and never execute.
- A market-wide halt is rare and temporary. Trading resumes after the cool-off; the pause itself is a feature, not a failure.
The honest catch
Circuit breakers are sensible, but they are not a cure. They can frustrate you: when a stock is locked, you simply cannot trade it the way you want, and the price you see is not one you can actually transact at. They can also bottle up pressure rather than release it — a stock locked at the lower circuit can gap down hard the next day once the band resets and the trapped sellers finally find buyers. And a halt does not change the underlying news; it only delays the market’s reaction to it. Bands smooth the speed of price discovery; they do not change where supply and demand ultimately settle. Treat a circuit as a caution light, not a green or red one.
Moments like a locked circuit make a lot more sense once you can see the balance of buyers and sellers behind them. TrueTrend is built to make that market structure readable for everyday learners, in plain language. You can start free and explore the context behind the moves.
Key takeaways
- A price band caps how far a single stock can move in a day; the ceiling is the upper circuit, the floor is the lower circuit.
- A locked upper circuit means overwhelming demand and scarce sellers; a locked lower circuit is the reverse.
- Bands exist to cool panic, catch fat-finger errors, and protect participants who can’t react in seconds.
- A circuit is a pause, not a ban — the stock can move again tomorrow from a fresh reference price.
- Market-wide circuit breakers halt the whole market in tiers (e.g. 10%, 15%, 20% index falls), with bigger falls causing longer pauses.
- Brakes control the speed of price discovery, not the final price — pressure can simply spill into the next session.
See these concepts on live market data — free
Create a free TrueTrend account to watch daily support/resistance levels, market regime, and option-positioning charts on NIFTY, BankNifty and 12 more instruments. Every level we publish is scored on a public scoreboard — misses included. No card required.
Free forever tier · daily levels with published hit-rates across every instrument. Descriptive market structure, not investment advice.
Not ready for an account? Get the daily levels by email.
One short email each market day — the indices' call wall, put wall, gamma flip and max pain, and how the last session's levels scored. Free, no account, unsubscribe anytime.
Descriptive market structure, not investment advice. We never share your email.