The Debt-to-Equity Ratio Explained for Beginners
Debt is neither good nor evil — it is a tool, like fire. Used carefully it powers growth; used carelessly it burns the house down. The Debt-to-Equity ratio, usually written D/E, is the single number analysts reach for to see how much fire a company is playing with. It compares the money a business has borrowed against the money its owners have put in, and it is one of the first things to check before you trust a company's profits.
What the Debt-to-Equity ratio is
The formula could not be simpler:
D/E = total debt ÷ shareholders' equity
Let us define both parts.
- Total debt is the money the company owes to lenders — loans, bonds, and other borrowings on which it must pay interest.
- Shareholders' equity is the owners' stake: the money put in plus profits kept in the business over the years. It is the same "net worth" figure — assets minus liabilities.
So a D/E of 1.0 means the company is funded half by lenders and half by owners — ₹1 of debt for every ₹1 of equity. A D/E of 0.2 means it leans mostly on its own money. A D/E of 2.5 means borrowings are two-and-a-half times the owners' stake.
An everyday analogy
Think of buying a ₹1 crore flat. If you pay ₹80 lakh from savings and take an ₹20 lakh loan, your personal D/E is 0.25 — comfortable. If instead you put in ₹20 lakh and borrow ₹80 lakh, your D/E is 4.0. In a rising market you look like a genius, because your small deposit controls a big asset. But if you lose your job, that large EMI does not care about market conditions — it arrives every month regardless. Companies face the same trade-off, only the "EMI" is their interest bill.
A worked example with round numbers
Take a fictional manufacturer, IronWorks Ltd. Its balance sheet shows total debt of ₹600 crore and shareholders' equity of ₹400 crore. Its D/E is ₹600 ÷ ₹400 = 1.5.
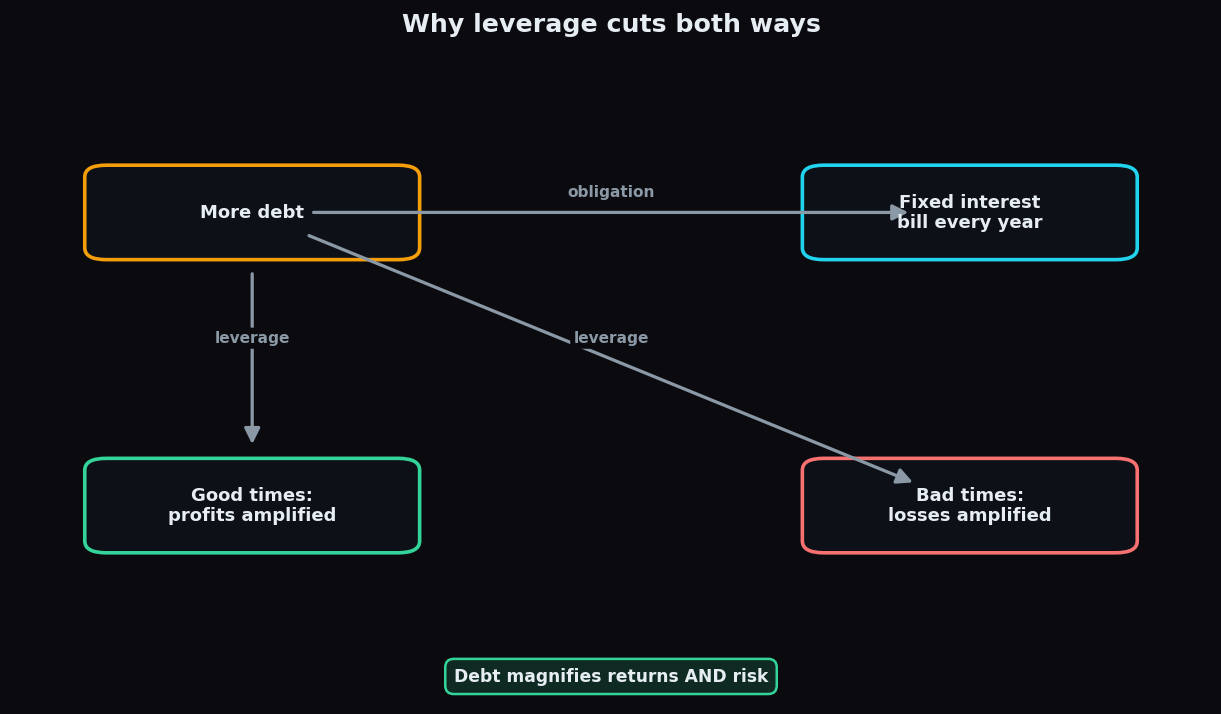
Now suppose the business earns ₹100 crore of operating profit and pays ₹48 crore in interest on that debt. Nearly half its operating profit is going straight to lenders before a single rupee reaches shareholders. In a good year that leverage magnifies the owners' returns. In a bad year — say operating profit halves to ₹50 crore — that same ₹48 crore interest bill suddenly swallows almost everything. This is the double-edged nature of borrowing, and the diagram below captures it.
Why it matters
The D/E ratio matters because debt introduces a fixed obligation. Equity is patient — shareholders can wait through a weak year. Debt is not — interest and repayments fall due on schedule whether business is booming or collapsing. A company with heavy debt has less room to survive a downturn, a rate rise, or a demand shock. That is why lenders, rating agencies, and cautious investors all watch D/E closely: it is a gauge of financial resilience.
Moderate debt, on the other hand, can be efficient. Borrowed money is usually cheaper than equity, and interest is tax-deductible, so a business that borrows sensibly can grow faster and lift returns for its owners. The goal is not zero debt — it is appropriate debt.
Why "healthy" is sector-relative
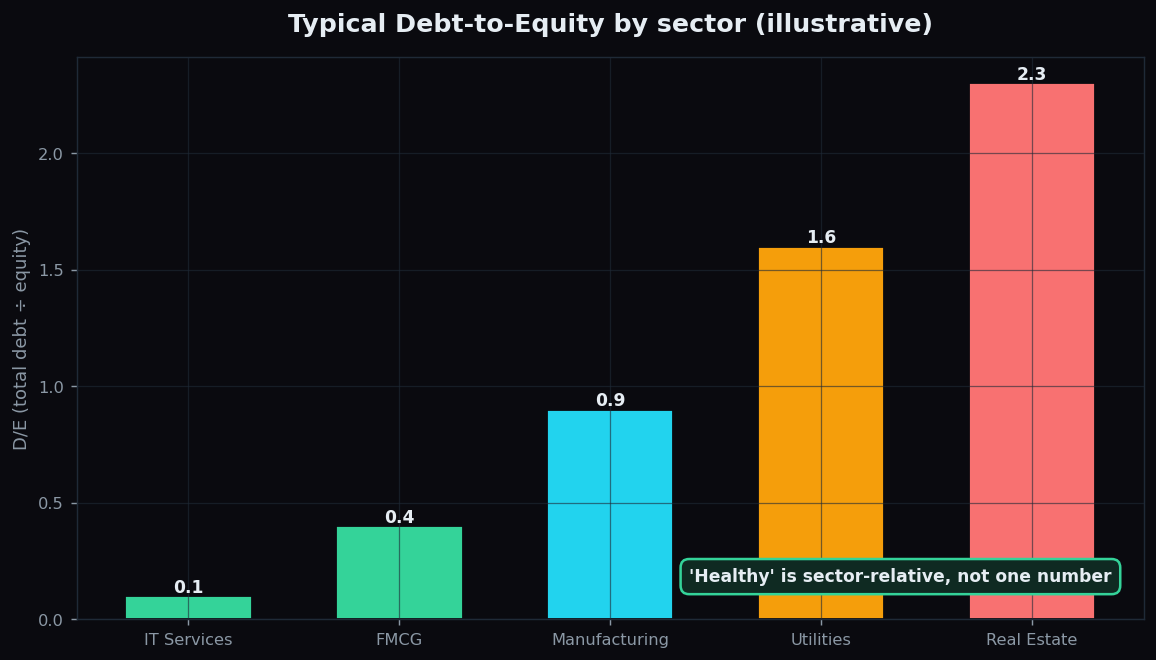
Here is the part beginners most often miss: there is no universal safe number. What counts as reckless in one industry is perfectly normal in another. A software services firm generates steady cash and needs little machinery, so it can run near-zero debt — a D/E above 0.5 would look unusual. A power utility or a real-estate developer, by contrast, funds enormous long-life assets with borrowings, and a D/E of 1.5 or 2.0 can be entirely routine because the cash flows are predictable and the assets are solid collateral.
The illustrative chart above shows how the "normal" band shifts across sectors. Reading a manufacturer's D/E against a utility's would be like judging a sprinter and a marathon runner by the same finish time. Always compare a company with its own history and with direct peers.
How investors use it
Analysts rarely look at D/E in isolation. They pair it with a few companion checks:
- Interest coverage — operating profit divided by the interest bill. It shows how many times over the company can pay its interest. A high D/E with strong coverage is far less worrying than a moderate D/E with thin coverage.
- The trend over time. Debt creeping up year after year, especially without matching growth in profit, is a yellow flag worth investigating.
- The nature of the debt. Long-term borrowing at a fixed rate is easier to plan around than short-term debt that must be refinanced repeatedly.
The honest catch
The ratio has genuine limits.
- Book equity can be distorted. Years of losses or heavy buybacks can shrink equity, mechanically inflating D/E even if borrowings have not changed.
- Off-balance-sheet items hide. Some obligations, like certain leases, may not show up as classic debt, understating the true leverage.
- It says nothing about cash. A company can carry high debt but also hold a large cash pile; a "net debt" view (debt minus cash) sometimes tells a truer story.
- It is a snapshot. D/E captures one moment; a business raising debt to fund a temporary expansion looks the same as one drowning in it, until you read the context.
Used with those caveats, D/E is one of the most practical resilience checks a beginner can run — a quick read on whether a company's returns rest on a solid foundation or a borrowed one.
Leverage rewards the informed and punishes the careless — which is exactly why TrueTrend focuses on giving beginners clear, honest context rather than hype. You can start free and learn to read the numbers behind the story.
Key takeaways
- D/E = total debt ÷ shareholders' equity. It shows how much a company leans on borrowed money versus its own.
- Debt magnifies returns in good times and losses in bad times, while creating a fixed interest bill that never pauses.
- There is no universal safe level — a "healthy" D/E is sector-relative, so compare like with like.
- Pair D/E with interest coverage and its multi-year trend before drawing conclusions.
- Watch for distortions from buybacks, hidden leases, and large cash balances — the raw ratio is a snapshot, not the full picture.
See these concepts on live market data — free
Create a free TrueTrend account to watch daily support/resistance levels, market regime, and option-positioning charts on NIFTY, BankNifty and 12 more instruments. Every level we publish is scored on a public scoreboard — misses included. No card required.
Free forever tier · daily levels with published hit-rates across every instrument. Descriptive market structure, not investment advice.
Not ready for an account? Get the daily levels by email.
One short email each market day — the indices' call wall, put wall, gamma flip and max pain, and how the last session's levels scored. Free, no account, unsubscribe anytime.
Descriptive market structure, not investment advice. We never share your email.