Dividend Yield Explained: Income and the Yield Trap
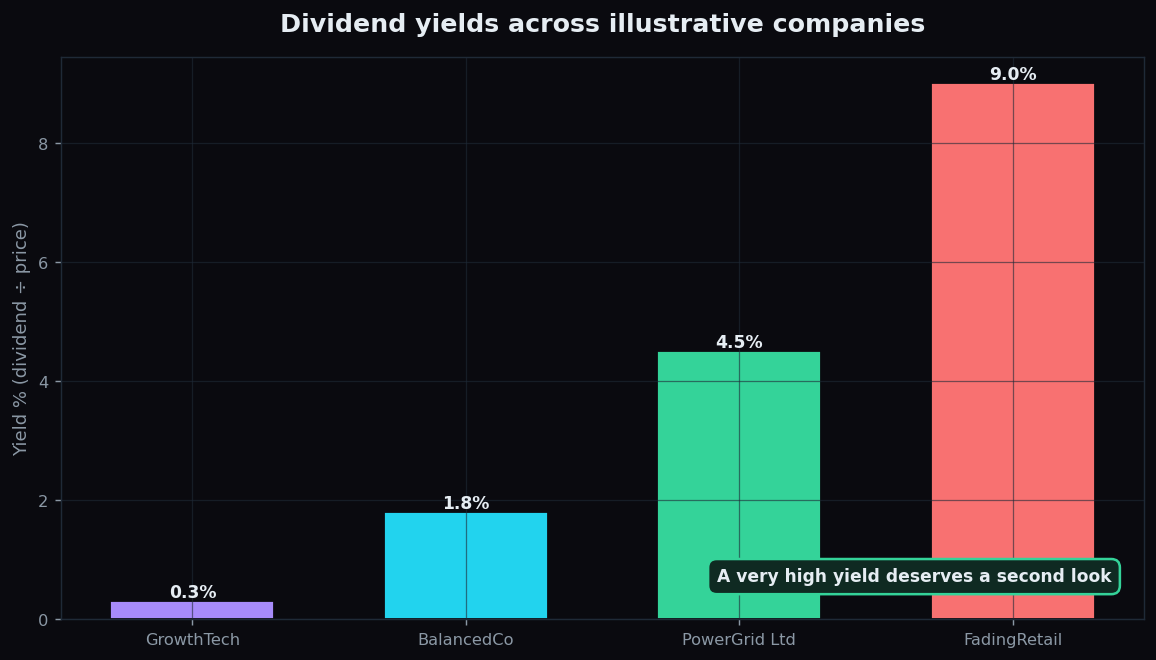
Some investors buy shares hoping the price climbs. Others buy them for the steady cash a company pays out along the way. That cash is the dividend, and the dividend yield is the number that tells you how much of it you get relative to the price you pay. It is one of the friendliest ratios in all of investing — and also one of the most quietly misleading, thanks to a trap that catches beginners every year.
What dividend yield is
First, two definitions.
- A dividend is a share of profit that a company hands back to its shareholders, usually in cash. Not every company pays one — younger, fast-growing firms often keep their profits to reinvest — but many mature, stable businesses pay a dividend every year.
- Dividend per share (DPS) is the total annual dividend divided by the number of shares, so it is the cash a single share receives in a year.
The dividend yield puts that payout against the share price:
Dividend yield = annual dividend per share ÷ share price × 100
It is expressed as a percentage, which makes it comparable to the interest rate on a fixed deposit — a way of asking, "for every ₹100 I invest at today's price, how much cash comes back to me each year in dividends?"
An everyday analogy
Think of buying a small shop that you rent out. The price of the shop is what you pay for it. The annual rent is your dividend. The rental yield — rent divided by price — is your dividend yield. Two shops paying the same ₹1 lakh rent are not equally attractive if one costs ₹10 lakh and the other ₹20 lakh: the cheaper one yields 10%, the pricier one just 5%. Same rent, different yield, because the price differs. Shares work exactly the same way.
A worked example with round numbers
Take a fictional utility, PowerGrid Ltd. Suppose it pays an annual dividend of ₹9 per share, and the stock trades at ₹200. Its dividend yield is ₹9 ÷ ₹200 × 100 = 4.5%. Buy ₹1,00,000 of the shares and, if the dividend holds, you would receive about ₹4,500 in cash over the year, quite apart from any change in the share price.
Notice the two moving parts. If the company raised its dividend to ₹12 while the price stayed at ₹200, the yield would rise to 6% — a good kind of increase, driven by a bigger payout. But the yield can also rise for a bad reason, and that is where beginners get caught.
Why it matters
Dividend yield matters for a few practical reasons:
- It quantifies income. For investors who want regular cash flow — retirees, for instance — yield turns a vague idea of "income stocks" into a concrete percentage they can plan around.
- It hints at company maturity. A steady, meaningful yield often reflects a mature, cash-generating business that no longer needs to plough every rupee back into growth. A near-zero yield often reflects a younger firm reinvesting for expansion. Neither is better — they simply suit different goals.
- It offers a rough comparison. Because it is a percentage, yield lets investors line up dividend income against other options like bonds or deposits, though the risks are very different.
The yield trap — the crucial caveat
Here is the catch that gives this ratio its reputation. Look again at the formula: yield is dividend divided by price. That means a yield can shoot up not because the dividend grew, but because the price collapsed. A falling share price mechanically lifts the yield, even as the business behind it may be deteriorating.
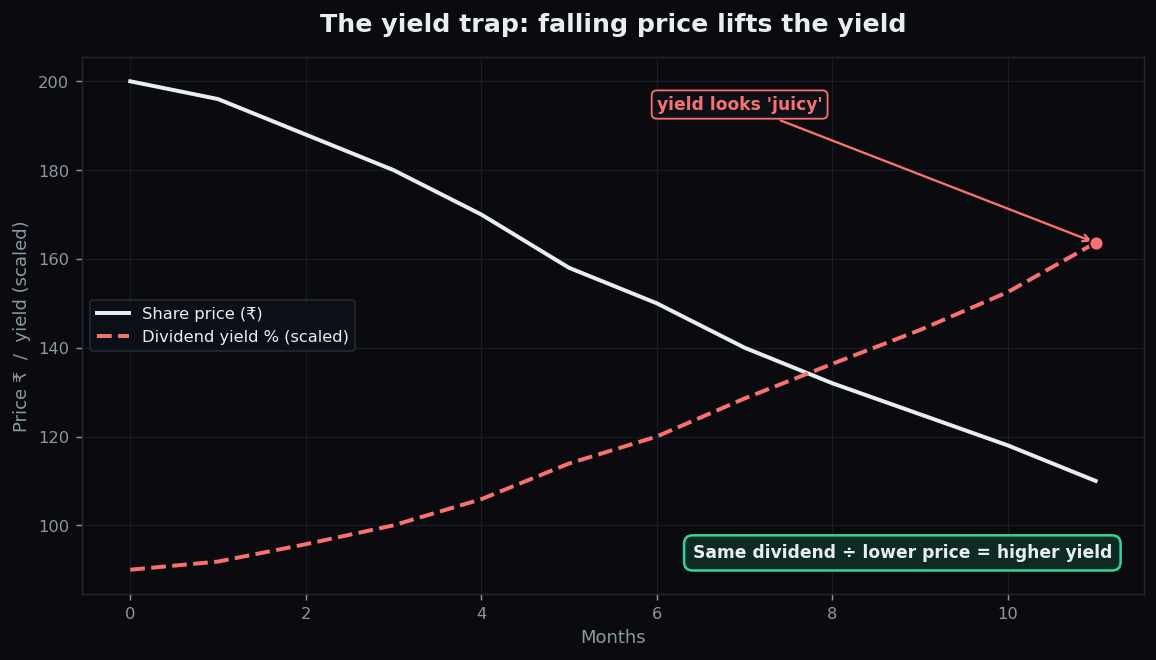
The chart tells the story. As the price slides from ₹200 down toward ₹110 while the dividend stays at ₹9, the yield climbs from about 4.5% to over 8%. To a screen sorted by "highest yield", the stock now looks irresistibly generous. But the rising yield is a symptom of the falling price, and a company in trouble may soon cut its dividend — at which point the yield vanishes and the price has already fallen. This is the yield trap: a sky-high yield that is often read as a warning sign rather than a gift.
The lesson is not that high yields are bad, but that a very high yield is a question, not an answer. It asks: is this payout sustainable, or is the market pricing in a cut?
How careful investors read it
To tell a healthy yield from a trap, analysts look beyond the headline number:
- The payout ratio — the share of profit paid out as dividends. A company paying out more than it earns cannot keep it up for long.
- The dividend history. A long record of steady or rising dividends is more reassuring than a single fat payout.
- Why the yield is high. Is it because the dividend grew, or because the price fell? The two lead to very different conclusions.
- Cash flow, not just profit. Dividends are paid in cash, so a business that generates strong cash is better placed to keep paying.
The honest catch
Even a healthy yield has limits worth remembering.
- Dividends are never guaranteed. Unlike a fixed-deposit rate, a company can cut or cancel its dividend at any time. The yield you see today is based on the last payout, not a promise.
- High yield can mean low growth. A company paying most of its profit out as dividends may have little left to grow with, so the share price may rise slowly.
- Total return is what counts. Yield is only the income part. The full picture of an investment is dividends plus price change — a 6% yield means little if the price falls 20%.
Understood with that context, dividend yield is a genuinely useful lens — a quick read on the income a share offers, as long as you always ask why the number is what it is.
A big yield can be a reward or a warning — telling them apart takes context, which is exactly what TrueTrend is built to give beginners. You can start free and learn to read the story behind the number.
Key takeaways
- Dividend yield = annual dividend per share ÷ share price × 100. It shows the cash income a share offers relative to its price.
- A steady yield often reflects a mature, cash-generating business; a near-zero yield often reflects a firm reinvesting for growth.
- The yield trap: a yield can spike simply because the price fell, flagging a business the market fears may cut its dividend.
- Check the payout ratio, dividend history, and cash flow to judge whether a yield is sustainable.
- Dividends are never guaranteed, and total return — income plus price change — is what ultimately matters.
See these concepts on live market data — free
Create a free TrueTrend account to watch daily support/resistance levels, market regime, and option-positioning charts on NIFTY, BankNifty and 12 more instruments. Every level we publish is scored on a public scoreboard — misses included. No card required.
Free forever tier · daily levels with published hit-rates across every instrument. Descriptive market structure, not investment advice.
Not ready for an account? Get the daily levels by email.
One short email each market day — the indices' call wall, put wall, gamma flip and max pain, and how the last session's levels scored. Free, no account, unsubscribe anytime.
Descriptive market structure, not investment advice. We never share your email.