EPS (Earnings Per Share) Explained for Beginners
When a company announces it made ₹1,000 crore in profit, that headline number sounds impressive — but on its own it tells you almost nothing about what a single share is worth. A giant profit split across billions of shares can mean less per share than a modest profit split across a few. Earnings Per Share, or EPS, does the division for you. It is the slice of the company's net profit that belongs to each individual share, and it sits at the heart of almost every valuation you will ever read.
What EPS actually is
The core formula is straightforward:
EPS = net profit available to shareholders ÷ number of shares outstanding
Two terms to define:
- Net profit is what is left after a company pays every cost — raw materials, salaries, interest on its debt, and tax. It is the true bottom line, the last row of the profit-and-loss statement.
- Shares outstanding is the total number of shares the company has issued and that are held by all its investors.
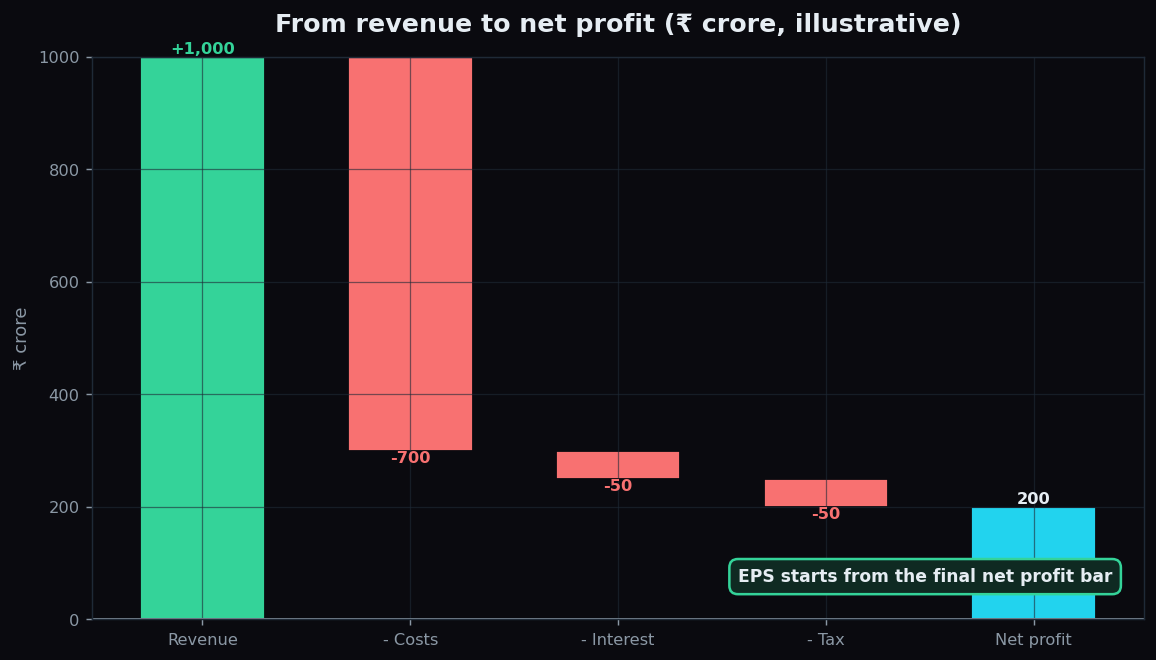
To reach that net profit, revenue passes through a series of deductions. The waterfall below walks an illustrative company from ₹1,000 crore of revenue down to the ₹200 crore of net profit that EPS is built from.
An everyday analogy
Picture a family pizza cut into slices. The whole pizza is the company's net profit. The number of slices is the number of shares. EPS is simply the size of one slice. A bigger pizza cut into far more slices can still leave each person with a smaller piece than a modest pizza shared among a few. That is why investors care about the slice, not just the pizza — you own slices, not the whole pie.
A worked example with round numbers
Take a fictional firm, NovaSoft. Suppose in a year it earns a net profit of ₹200 crore and has 10 crore shares outstanding. Its EPS is ₹200 crore ÷ 10 crore = ₹20 per share.
Now say the next year net profit rises to ₹250 crore while the share count stays the same. EPS climbs to ₹25 — a 25% rise. Growing EPS over time is one of the clearest signs that a business is becoming more profitable per unit of ownership, which is what a shareholder ultimately cares about.
EPS also feeds the most quoted ratio in investing, the Price-to-Earnings (P/E) ratio, which is simply the share price divided by EPS. If NovaSoft trades at ₹400 and its EPS is ₹20, its P/E is 20 — the market is paying ₹20 for every ₹1 of annual earnings. Without EPS, that whole valuation language falls apart.
Basic EPS versus diluted EPS
Companies report EPS in two flavours, and knowing the difference keeps you from being surprised.
- Basic EPS uses the shares that actually exist today. It is the straightforward calculation above.
- Diluted EPS asks a cautious "what if?" question. Many companies have instruments — employee stock options, convertible bonds, and warrants — that could turn into new shares in the future. If they all converted, the share count would rise and the same profit would be spread thinner. Diluted EPS assumes that fuller share count, giving a more conservative figure.
Suppose NovaSoft's ₹200 crore profit stays fixed, but on top of its 10 crore existing shares there are options and convertibles that could create another 1.5 crore shares. Diluted EPS uses 11.5 crore shares: ₹200 crore ÷ 11.5 crore ≈ ₹17.4. The gap between ₹20 and ₹17.4 is the dilution — the shrinkage each existing share would feel if everything converted.
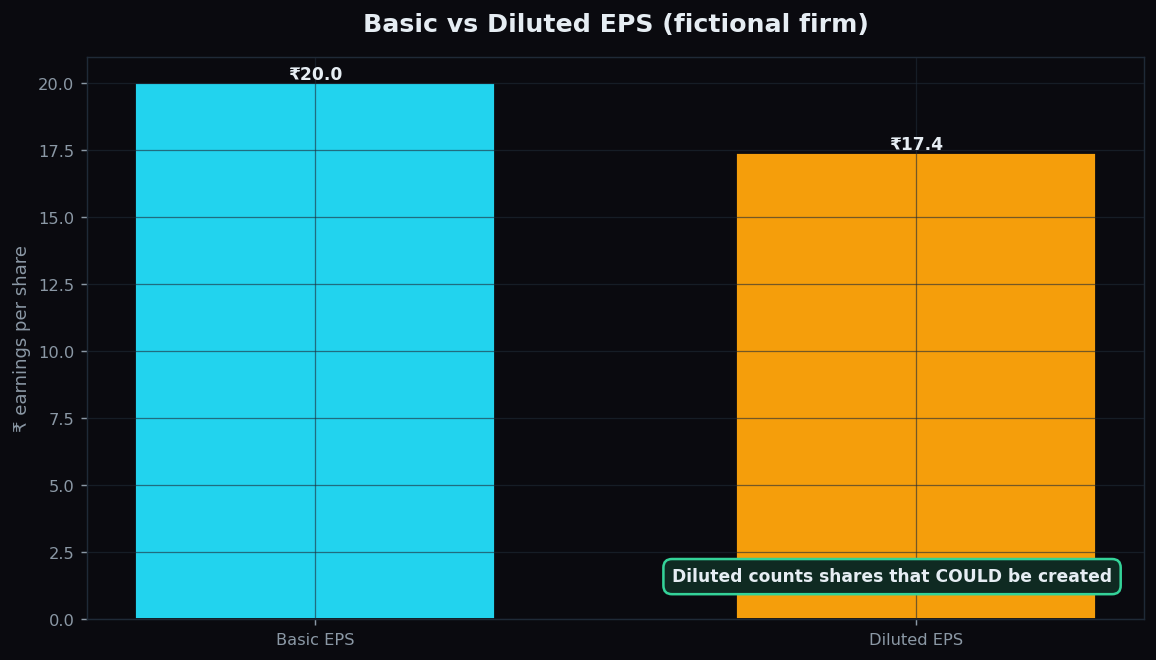
Because diluted EPS is the more prudent number, it is often read as the truer picture of per-share earning power, especially for younger companies that hand out a lot of stock options. A wide gap between basic and diluted EPS is worth noticing — it flags heavy potential dilution ahead.
Why EPS matters
EPS matters because it is the common language of company performance. It lets you:
- Track a business over time. Rising EPS across several years suggests genuine, compounding improvement in profitability per share.
- Compare across companies. Because it is expressed per share, EPS puts a small firm and a giant on a more comparable footing than raw profit ever could.
- Anchor valuation. Through the P/E ratio and its cousins, EPS is the foundation on which most price-versus-value discussions are built.
The honest catch
EPS is essential, but it is easy to over-trust. Watch for these traps.
- Accounting choices bend it. Net profit can be nudged by depreciation methods, one-time gains, or asset sales. A single big property sale can inflate EPS for a year without any real operating improvement.
- Buybacks can flatter it. When a company buys back its own shares, the share count falls, so EPS can rise even if net profit is flat. The per-share number looks better while the business has not changed.
- It ignores the balance sheet. EPS says nothing about how much debt was taken on to produce that profit, or how much cash the business actually generated.
- One year is noise. A single quarter or year of EPS can be distorted by seasonality or one-offs. The trend across several years is far more telling than any single figure.
Used wisely — the diluted number, over several years, alongside cash flow and debt — EPS is one of the most useful building blocks a beginner can master.
Numbers like EPS only become powerful when you understand what sits behind them. TrueTrend is built to give beginners that plain-English context — you can start free and learn to read a company's results with confidence.
Key takeaways
- EPS = net profit ÷ shares outstanding — the profit belonging to each single share.
- It turns a giant, hard-to-compare profit figure into a per-share number you can track and compare.
- Basic EPS uses today's shares; diluted EPS assumes options and convertibles turn into new shares, giving a more conservative figure.
- EPS anchors the P/E ratio, the most quoted valuation measure in the market.
- It can be flattered by buybacks and bent by accounting choices — read it over several years, not one.
- Pair EPS with cash flow and debt; a rising slice means little if the underlying pizza is shrinking.
See these concepts on live market data — free
Create a free TrueTrend account to watch daily support/resistance levels, market regime, and option-positioning charts on NIFTY, BankNifty and 12 more instruments. Every level we publish is scored on a public scoreboard — misses included. No card required.
Free forever tier · daily levels with published hit-rates across every instrument. Descriptive market structure, not investment advice.
Not ready for an account? Get the daily levels by email.
One short email each market day — the indices' call wall, put wall, gamma flip and max pain, and how the last session's levels scored. Free, no account, unsubscribe anytime.
Descriptive market structure, not investment advice. We never share your email.