FII and DII Flows Explained for Beginners
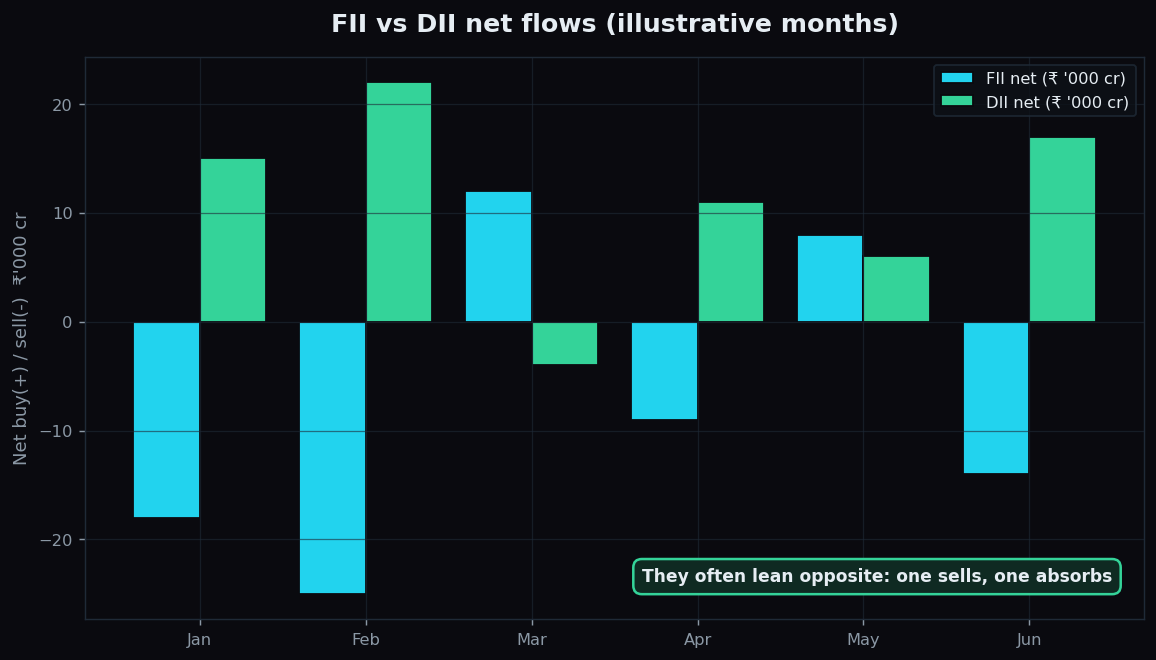
On any given day, two very different kinds of “big money” are trading Indian stocks: foreigners parking money here from abroad, and large Indian institutions investing on behalf of millions of savers. When these giants buy or sell in size, the whole market can lean with them. This post explains who they are, why their flows matter, and how to read the tug-of-war between them — all with simple, made-up numbers.
What FII and DII actually mean
A Foreign Institutional Investor (FII) — often also called an FPI, Foreign Portfolio Investor — is a large overseas investor: a global pension fund, a sovereign wealth fund, a hedge fund, or an international asset manager that buys Indian shares and bonds. Their money comes from outside India and can leave just as quickly.
A Domestic Institutional Investor (DII) is a large Indian institution doing the same thing with local money: mutual funds, insurance companies such as LIC, pension bodies, and banks. Much of this is the steady monthly savings of ordinary Indians — for example, the SIPs (Systematic Investment Plans) flowing into mutual funds every month.
The word flow just means the net money moving in or out over a period. If FIIs buy shares worth ₹30,000 crore and sell ₹42,000 crore in a month, their net flow is −₹12,000 crore — a net outflow.
Why these flows move markets
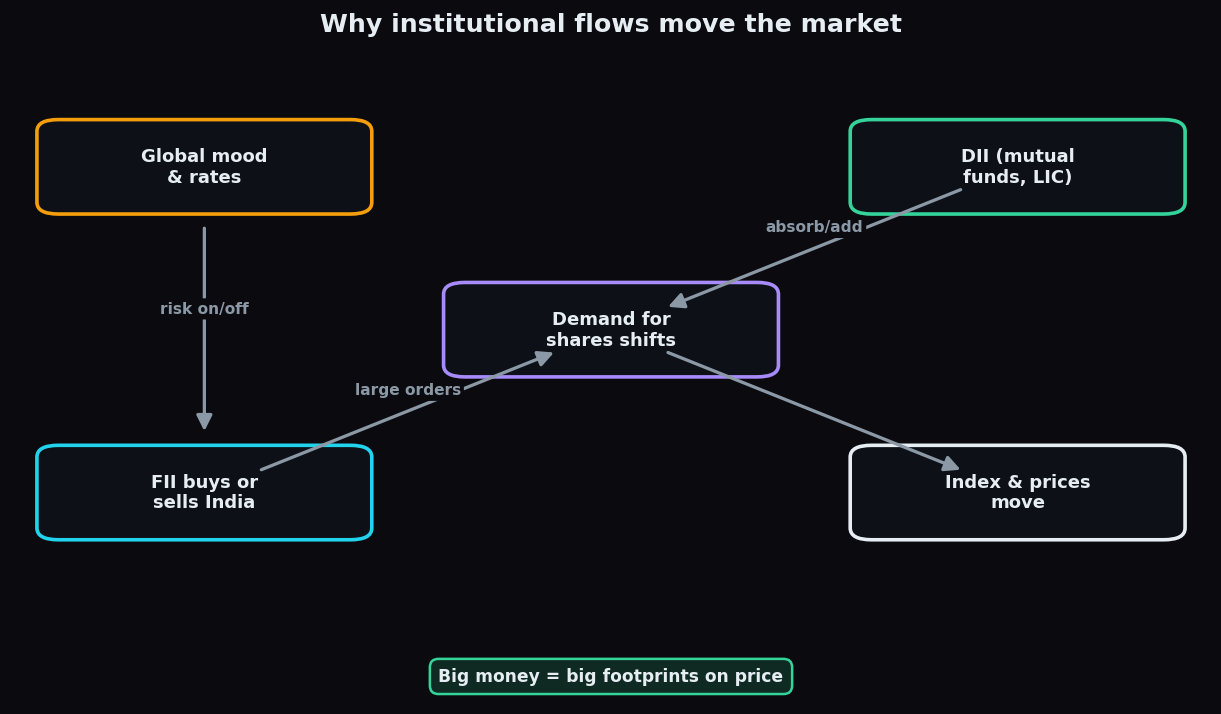
Think of the market as a large weighing scale. Retail investors like you and me add small weights on both sides all day. FIIs and DIIs, by contrast, drop heavy blocks. Because they trade in huge sizes, their orders can tip prices — not because they are smarter, but because they are bigger.
FIIs matter especially for the largest, most liquid stocks — the index heavyweights. When a global fund decides India looks attractive, its buying lifts exactly those names that dominate the Nifty and Sensex, so the index moves. When global fear rises and the same fund pulls money back home, that selling drags the index down.
What drives FIIs in and out? Mostly the global backdrop: interest rates in the US, the strength of the rupee versus the dollar, oil prices, and the general appetite for “risk.” This is why Indian markets sometimes fall on a day when nothing bad happened in India — the trigger was overseas.
The FII-versus-DII tug-of-war
Here is the interesting part. FIIs and DIIs often lean in opposite directions. On days when foreigners are heavy sellers, domestic institutions frequently step in as buyers — and the other way around. It is like a see-saw where one side leaving is partly balanced by the other side sitting down.
This matters because it changes how a piece of news lands. If FIIs sell ₹15,000 crore but DIIs absorb ₹14,000 crore of it, the market barely moves — the domestic cushion soaked up the foreign exit. But if FIIs sell ₹15,000 crore and DIIs only buy ₹3,000 crore, the net pressure is a large ₹12,000 crore of selling with no cushion, and prices can fall sharply.
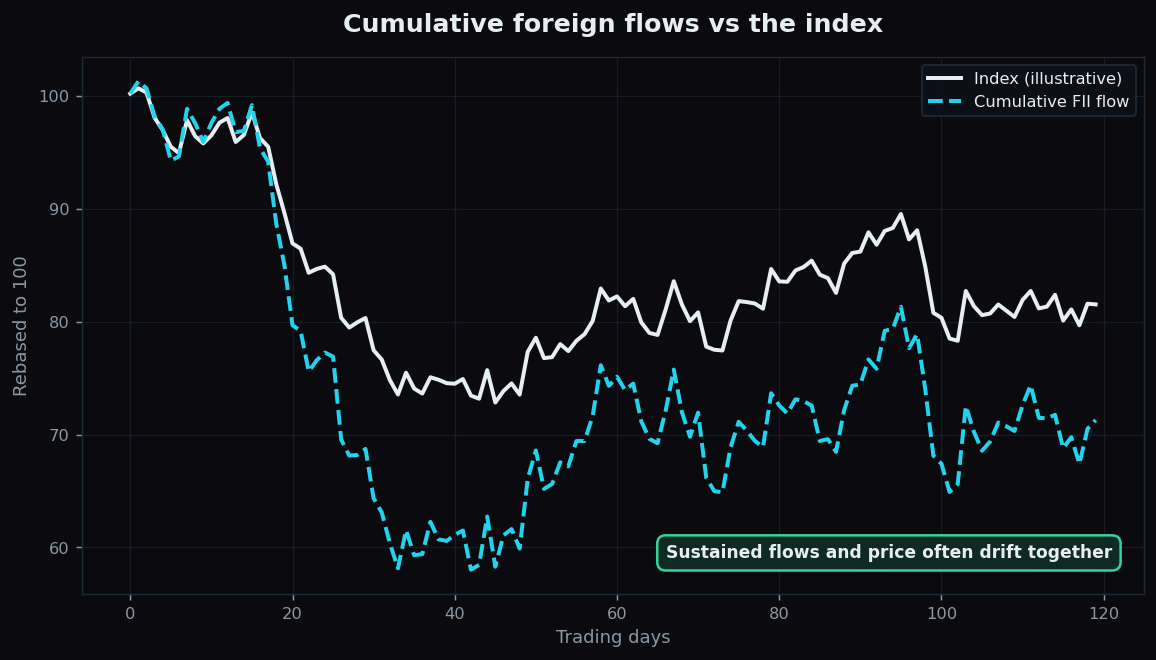
Over long stretches, if both groups drift the same way, the index and the running total of flows tend to move together. The chart below rebases an illustrative index and a cumulative flow line to a common start of 100 so you can see them drift in tandem.
A worked example with round numbers
Suppose over one week the numbers look like this (all illustrative):
- Monday: FII −₹8,000 cr, DII +₹7,500 cr → net −₹500 cr. Market roughly flat — DIIs cushioned it.
- Tuesday: FII −₹9,000 cr, DII +₹2,000 cr → net −₹7,000 cr. Market down noticeably — thin cushion.
- Wednesday: FII +₹6,000 cr, DII +₹1,000 cr → net +₹7,000 cr. Market up — both leaning the same way.
Notice that the FII number alone did not tell the story. On Monday and Tuesday the FII outflow was similar, yet the market reaction was very different, because the domestic response differed. Reading both sides together is the whole point.
The honest catch
Flow data is genuinely useful context, but it comes with real limits:
- It is backward-looking. Official FII/DII figures are published after the session. By the time you read them, prices have already moved. They explain yesterday better than they predict tomorrow.
- Cash-market flows miss derivatives. The headline numbers usually cover the cash segment. A big player can be a net seller in cash while hedged or positioned very differently in futures and options, so the true picture is more tangled.
- One day proves little. A single day of heavy selling can be a fund rebalancing, an index change, or a one-off. A trend over weeks carries far more meaning than any single print.
- It is not a signal to act. “FIIs sold” does not mean prices must fall next, and it is certainly not a nudge to trade. It is one gauge on a crowded dashboard.
Global cues are closely tied to this whole topic, since foreign flows respond to the overnight world. If you want to see how that morning hand-off works, our explainer on GIFT Nifty and global cues pairs naturally with this one.
Want to watch the daily FII–DII tug-of-war in plain language instead of raw spreadsheets? TrueTrend turns institutional flow context into simple, readable dashboards. Create a free account to explore it.
Key takeaways
- FIIs are large foreign investors; DIIs are big Indian institutions like mutual funds and insurers investing local savings.
- Because they trade in huge sizes, their net flows can move the index — especially the heavyweight stocks.
- FIIs and DIIs often lean opposite ways; the net of the two, not either alone, drives the day.
- Flow data is context, not a crystal ball — it is backward-looking, misses derivatives, and means most over weeks, not a single day.
See these concepts on live market data — free
Create a free TrueTrend account to watch daily support/resistance levels, market regime, and option-positioning charts on NIFTY, BankNifty and 12 more instruments. Every level we publish is scored on a public scoreboard — misses included. No card required.
Free forever tier · daily levels with published hit-rates across every instrument. Descriptive market structure, not investment advice.
Not ready for an account? Get the daily levels by email.
One short email each market day — the indices' call wall, put wall, gamma flip and max pain, and how the last session's levels scored. Free, no account, unsubscribe anytime.
Descriptive market structure, not investment advice. We never share your email.