GDP Explained and Why Markets Watch It
Every few months a single figure grabs the headlines and gets economists arguing on TV: the country's GDP growth. It is treated as the ultimate scoreboard for the economy. Yet the stock market's reaction to it is often muddled — sometimes markets yawn at strong GDP, sometimes they rally on weak numbers. This post explains what GDP actually measures, what it is made of, and why markets and GDP do not always move in step, using plain language and round numbers.
What GDP measures
GDP stands for Gross Domestic Product. It is the total value of all the finished goods and services a country produces in a given period — usually a quarter (three months) or a full year. If every shop sale, every service, every factory's output were added up, that grand total is GDP.
The number you usually hear is GDP growth — how much bigger the total is compared with the same period a year earlier. “GDP grew 7%” means the economy produced about 7% more value than it did a year ago. There is also an important distinction between nominal GDP (measured at current prices) and real GDP (stripped of inflation). Real GDP growth is the one that matters, because it shows genuine extra output, not just higher price tags.
The four ingredients of GDP
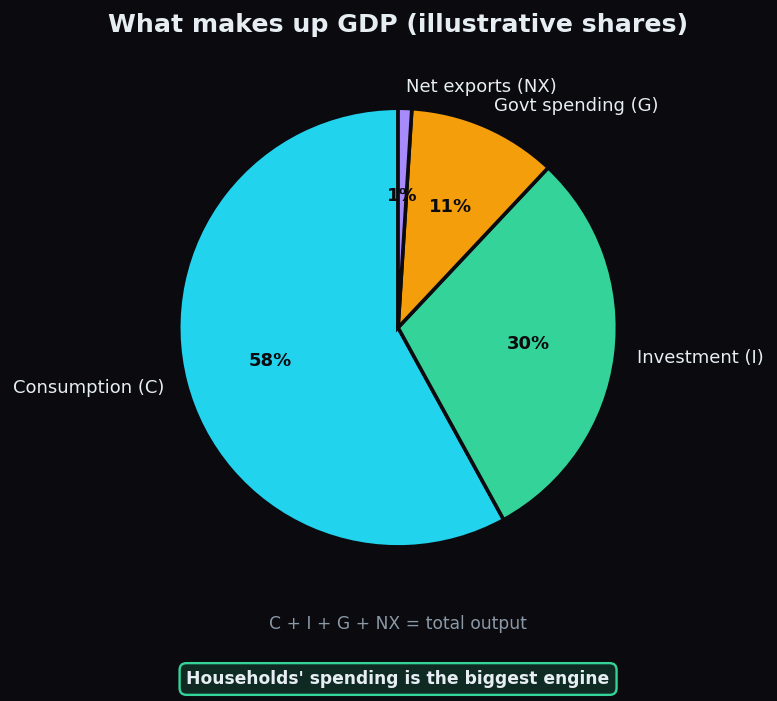
Economists slice GDP into four spending buckets, captured by a simple recipe: GDP = C + I + G + NX. Here is what each part means:
- C — Consumption: everything households spend on, from groceries and phones to haircuts and movie tickets. In India this is the largest slice by far.
- I — Investment: spending by businesses on factories, machines, and offices, plus construction of new homes. This is future-building spending.
- G — Government spending: what the government spends on roads, defence, salaries, and public services.
- NX — Net exports: exports minus imports. If a country buys more from abroad than it sells, this piece is negative.
The pie below shows an illustrative split. The exact shares differ by country and year, but the shape — consumption as the biggest engine — is typical of India.
An everyday analogy
Think of GDP as a household's total yearly activity. Consumption is the family's day-to-day spending on food and living. Investment is money put into a new room or a work tool that pays off later. Government spending is like the shared bills for the whole housing society. And net exports is whether the family earns more by selling things to neighbours than it spends buying from them. Add it all up and you have the family's economic year — that is a nation's GDP, scaled up.
Why markets watch GDP — and why the link is loose
Companies earn more when the economy is growing, so over the long run, rising GDP and rising corporate profits tend to travel together, and share prices with them. A healthy, growing economy is fertile ground for business. So GDP is a genuine barometer of the backdrop that companies operate in.
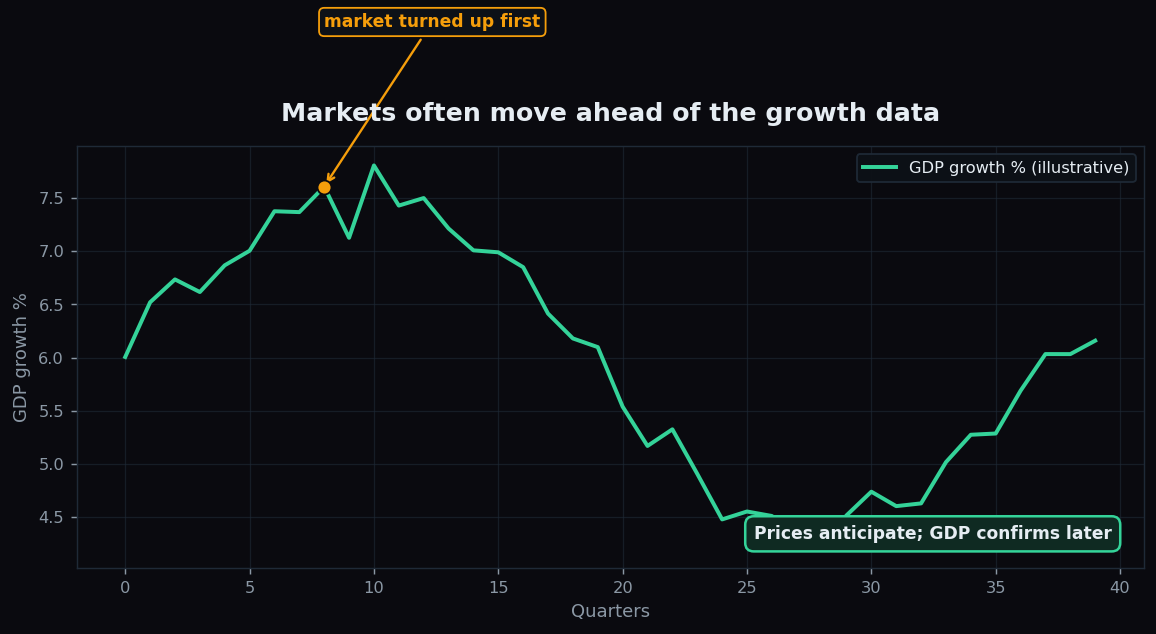
But here is the twist that confuses beginners: the stock market often moves before the GDP data arrives. Markets are forward-looking. Investors trade on what they expect the economy to do next quarter and next year, not on what a report says about the quarter that just ended. By the time strong GDP is officially confirmed, prices may have already risen in anticipation months earlier.
A worked example with round numbers
Suppose analysts expect GDP to grow 6% this quarter. Two scenarios show why the reaction depends on expectations, not the raw number:
- GDP comes in at 7%. Sounds great — but the market may barely move, because a strong number was already expected and priced in. The “surprise” above 6% is only mild.
- GDP comes in at 5%. Still positive growth — the economy expanded! Yet the market might fall, because 5% disappointed the 6% expectation.
The lesson: markets trade the gap between reality and expectation, not the headline itself. A “good” number that misses hopes can sink prices, while a “weak” number that beats gloomy fears can lift them.
The honest catch
GDP is one of the most important economic gauges, but it has real limits for a market watcher:
- It is old news by the time it prints. GDP reports the quarter that already ended, often with a lag of weeks or months. Markets have usually moved on.
- It gets revised. Early GDP figures are estimates and are later corrected, sometimes meaningfully. The first headline is not the final word.
- It is an average, not a mirror of the market. The index is dominated by a handful of large listed companies, while GDP covers the entire economy — including farms and small businesses that may never list. The two can diverge for long stretches.
- It is context, not a signal. Knowing GDP growth helps you understand the backdrop; it is not a nudge to act, and the numbers here are illustrative.
GDP surprises can also ripple through global flows and currencies, which reach our market overnight. Our companion note on global cues and Indian markets shows how that morning hand-off works.
Understanding the economic backdrop is easier when the context is laid out simply. TrueTrend distils market and macro context into clear, beginner-friendly dashboards. Start free to see how the pieces fit.
Key takeaways
- GDP is the total value of goods and services an economy produces; real GDP growth (inflation-adjusted) is the figure that matters.
- It is built from four parts: Consumption + Investment + Government spending + Net exports, with consumption usually the biggest in India.
- Markets are forward-looking and often move before GDP confirms a trend — they trade the gap between reality and expectation.
- GDP is backward-looking, gets revised, and covers the whole economy — so it is context for the backdrop, not a market signal.
See these concepts on live market data — free
Create a free TrueTrend account to watch daily support/resistance levels, market regime, and option-positioning charts on NIFTY, BankNifty and 12 more instruments. Every level we publish is scored on a public scoreboard — misses included. No card required.
Free forever tier · daily levels with published hit-rates across every instrument. Descriptive market structure, not investment advice.
Not ready for an account? Get the daily levels by email.
One short email each market day — the indices' call wall, put wall, gamma flip and max pain, and how the last session's levels scored. Free, no account, unsubscribe anytime.
Descriptive market structure, not investment advice. We never share your email.