How to Read a Balance Sheet: A Beginner's Guide
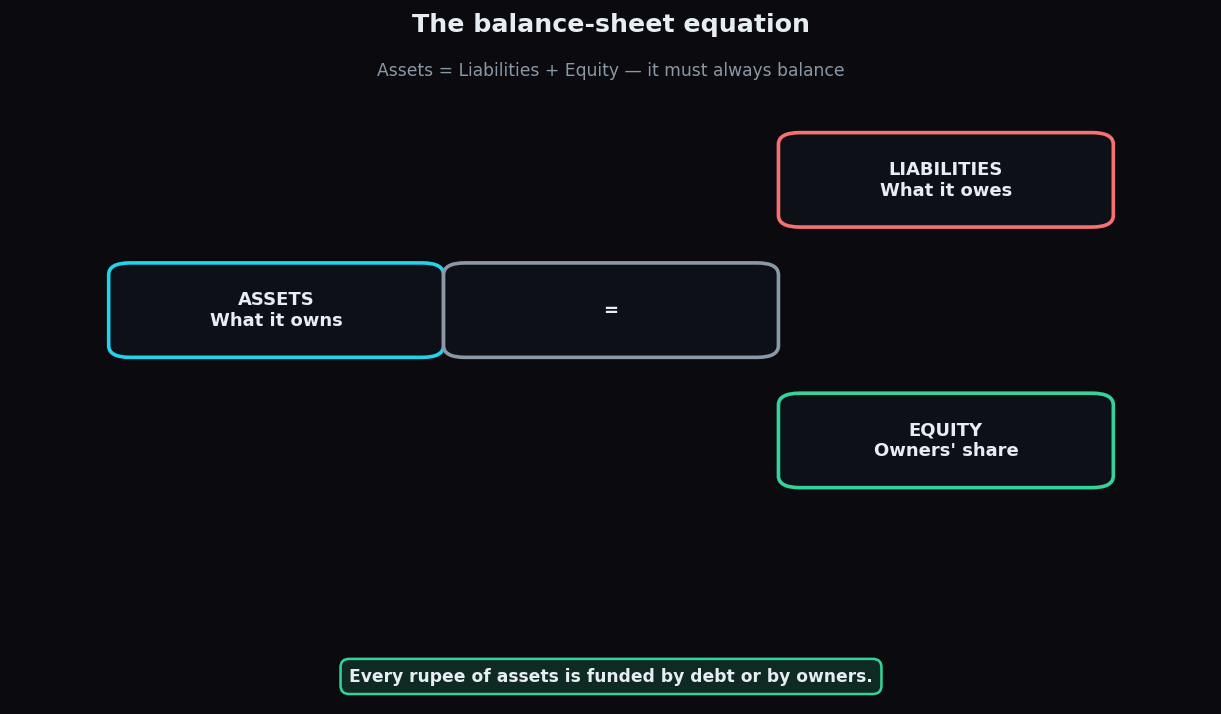
The balance sheet is the least glamorous of a company's three financial reports and, for many beginners, the most confusing. But strip away the jargon and it is simply a snapshot of what a business owns, what it owes, and what is left over for the owners — frozen on a single day. Learn to read it and you can spot a fragile company long before its share price does the shouting.
Here is a picture that captures the whole thing before we dig in.
The one equation that never breaks
Every balance sheet obeys a single rule, called the accounting equation:
- Assets = Liabilities + Equity
In plain words: everything a company owns (assets) was paid for either with borrowed money (liabilities) or with the owners' own money (equity). There is no third source. That is why the two sides always "balance" — and why the report is called a balance sheet.
Think of buying a Rs 50 lakh flat. You put down Rs 15 lakh of your own money and take a Rs 35 lakh loan. The flat (your asset) is worth 50. The loan (your liability) is 35. Your actual stake (equity) is 15. Assets 50 = Liabilities 35 + Equity 15. A company's balance sheet is the same idea, scaled up and split into more boxes.
The left side: assets (what it owns)
Assets are resources the business controls that are expected to bring future benefit. They are usually split by how quickly they turn into cash.
- Current assets — things expected to become cash within a year: cash itself, inventory (unsold goods), and receivables (money customers owe for sales already made).
- Non-current assets — longer-lived things: factories, machinery, land, and intangibles like patents or brand value.
Reading the asset side tells you what kind of business this is. A software firm is light on machinery and heavy on cash; a steel plant is the reverse.
The right side: liabilities (what it owes)
Liabilities are claims against the company — money it must eventually pay out. Again, they split by timing.
- Current liabilities — due within a year: bills to suppliers (payables), short-term loans, taxes owed.
- Non-current liabilities — due later: long-term borrowings, bonds.
A quick health check lives right here. Compare current assets with current liabilities. If a company owes Rs 200 crore within the year but only has Rs 120 crore of assets turning into cash in that time, it may have to scramble — borrow, sell things, or raise money on bad terms. That ratio (current assets ÷ current liabilities) is called the current ratio, and near 1 or below is a flag worth investigating.
What's left: equity (the owners' share)
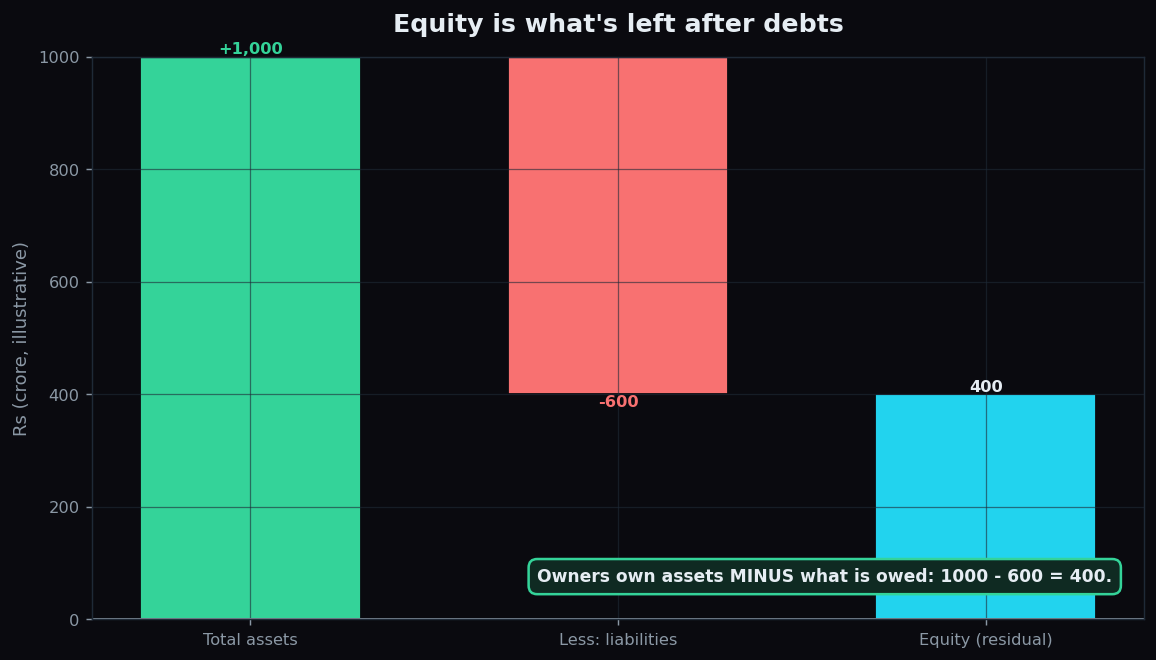
Equity is the residual — whatever remains of the assets after every liability is settled. It is the owners' genuine stake, and it is the number that grows over time as a healthy company retains profits. Rearranging the equation makes this obvious:
- Equity = Assets − Liabilities
A worked example with round numbers
Meet a fictional firm, Sunrise Textiles. Its balance sheet says:
- Total assets: Rs 1,000 crore (Rs 400 current, Rs 600 non-current)
- Total liabilities: Rs 600 crore (Rs 250 current, Rs 350 non-current)
- Equity: Rs 1,000 − Rs 600 = Rs 400 crore
What can we read from this? The equation balances (1000 = 600 + 400). Owners fund 400 of every 1000 in assets, and lenders fund 600 — so the company carries a fair amount of debt. On the short-term picture, current assets of 400 comfortably cover current liabilities of 250 (a current ratio of 1.6), which suggests it can pay its near-term bills without panic. None of this is a verdict on the stock; it is a description of the company's financial shape on that day.
The honest catch
A balance sheet is powerful, but keep its limits in mind.
- It is a single-day snapshot. A company can arrange things to look tidy on reporting day and messier the rest of the year (a trick sometimes called "window dressing").
- Book values are not market values. Land bought decades ago may sit at its old cost, wildly understating its worth; a fashionable brand's real value may not appear at all.
- It says nothing about performance. The balance sheet shows the position, not whether the business made money this year. For that you need the income statement, and for whether the profit was real cash, the cash flow statement.
Read all three together and the picture sharpens. Read one alone and you are looking at the elephant through a keyhole.
Learning to read a company one report at a time is a superpower most investors never build. TrueTrend is an analytics and education platform that turns market data into plain-language context — start free and learn by doing.
Key takeaways
- Every balance sheet obeys Assets = Liabilities + Equity, and it always balances.
- Assets are what the company owns; liabilities are what it owes; equity is the residual for owners.
- Comparing current assets with current liabilities (the current ratio) is a fast short-term health check.
- It is a single-day snapshot at book value — not market value, and not a measure of performance.
- Read it alongside the income and cash flow statements for the full story.
See these concepts on live market data — free
Create a free TrueTrend account to watch daily support/resistance levels, market regime, and option-positioning charts on NIFTY, BankNifty and 12 more instruments. Every level we publish is scored on a public scoreboard — misses included. No card required.
Free forever tier · daily levels with published hit-rates across every instrument. Descriptive market structure, not investment advice.
Not ready for an account? Get the daily levels by email.
One short email each market day — the indices' call wall, put wall, gamma flip and max pain, and how the last session's levels scored. Free, no account, unsubscribe anytime.
Descriptive market structure, not investment advice. We never share your email.