How to Read an Annual Report: A Beginner Guide
An annual report can look terrifying: a couple of hundred pages of tables, legal language and photographs of smiling staff. But you do not need to read all of it, and you certainly do not need an accounting degree. You just need to know which sections carry real information, in what order to read them, and which warning signs to watch for. This guide walks a beginner through exactly that.
What an annual report is
An annual report is the document a listed company publishes once a year to tell its owners — the shareholders — how the business did and where it stands. Part of it is a story told by management, and part of it is a set of audited numbers. Your job as a reader is to compare the two: does the confident story match the cold figures?
An everyday analogy
Think of it like a school report card combined with a letter from the student. The letter (management's commentary) explains the year in the best possible light. The marks (the financial statements) are checked by an examiner (the auditor). A smart parent reads the letter, but trusts the marks — and looks hardest at the subjects the letter quietly skips over.
The sections that actually matter
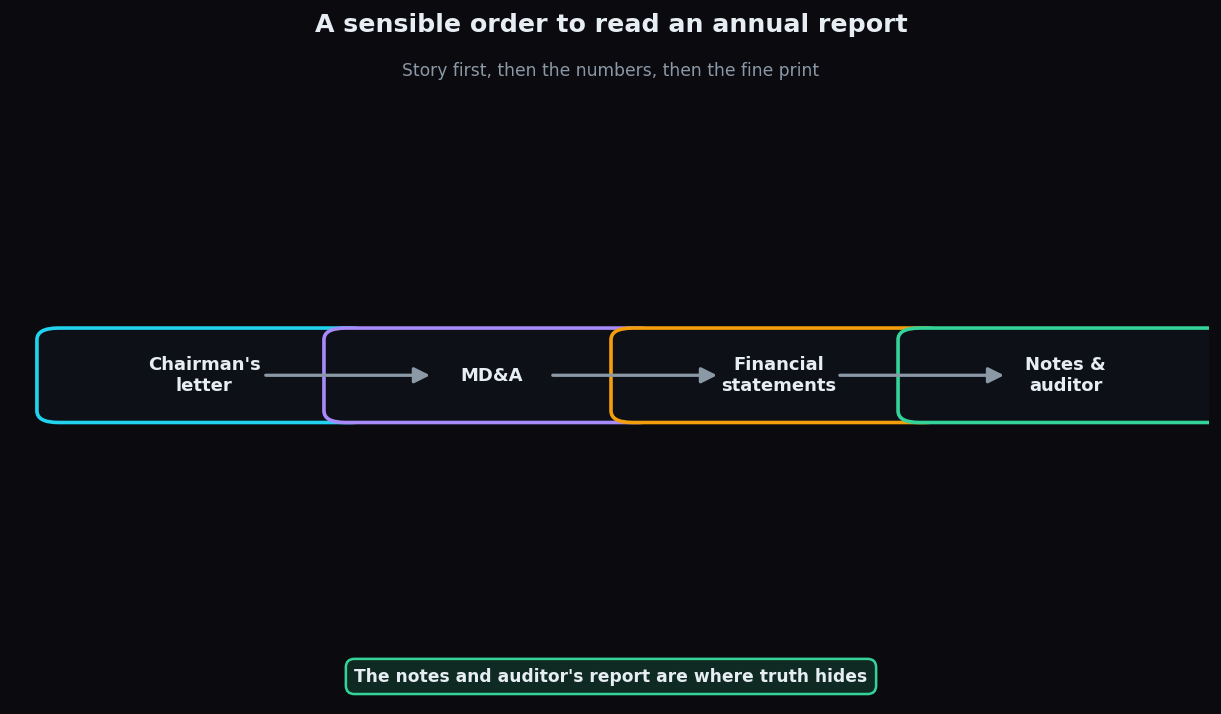
Read in this order and you will get the story first, then the facts, then the fine print that tests both.
- The Chairman's or CEO's letter. The big-picture narrative — strategy, wins, and challenges. Useful for tone, but remember it is written to reassure. Note what it emphasises and, more tellingly, what it glosses over.
- Management Discussion & Analysis (MD&A). The most valuable prose in the report. Here management explains why the numbers moved — which products grew, what squeezed margins, what risks they see. Read this closely.
- The financial statements. The three core tables: the income statement (profit over the year), the balance sheet (what the company owns and owes on one date), and the cash flow statement (actual cash in and out). These are the marks on the report card.
- The notes to the accounts. The fine print behind the tables — how numbers were calculated, debts due, legal cases, and accounting choices. Dry, but this is where problems often hide.
- The auditor's report. An independent firm's opinion on whether the accounts are fair. Short, but critical — more on this below.
Following the money through the income statement
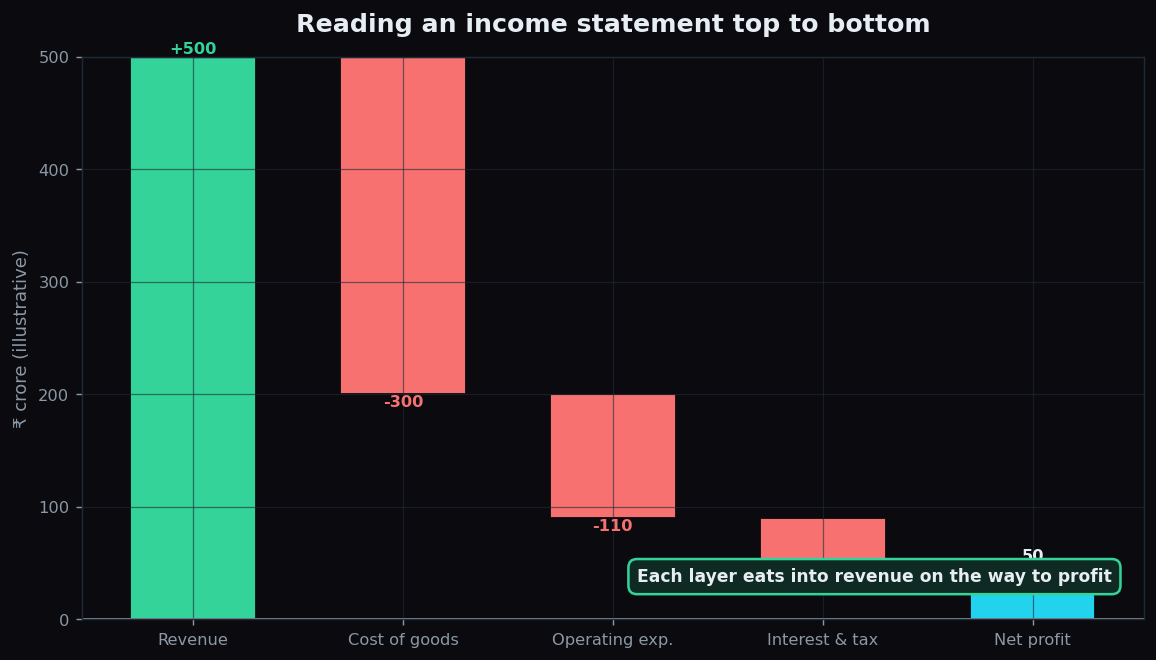
The income statement is easier than it looks — it is just revenue with costs peeled away layer by layer. Take a fictional firm, Sunrise Foods. It books ₹500 crore of revenue (total sales). Subtract ₹300 crore cost of goods (what it cost to make the product), then ₹110 crore of operating expenses (salaries, rent, marketing), then ₹40 crore of interest and tax. What survives at the bottom is ₹50 crore of net profit. Reading top to bottom shows you exactly where the money goes on its journey to the bottom line.
Why reading it carefully matters
Two companies can report the same headline profit and be in completely different health. The annual report is where that difference shows up — in the debt load, in whether profit turned into real cash, in the honesty of the accounting. Learning to read it means you form your own view instead of relying on a headline or a hot tip.
Common red flags to watch
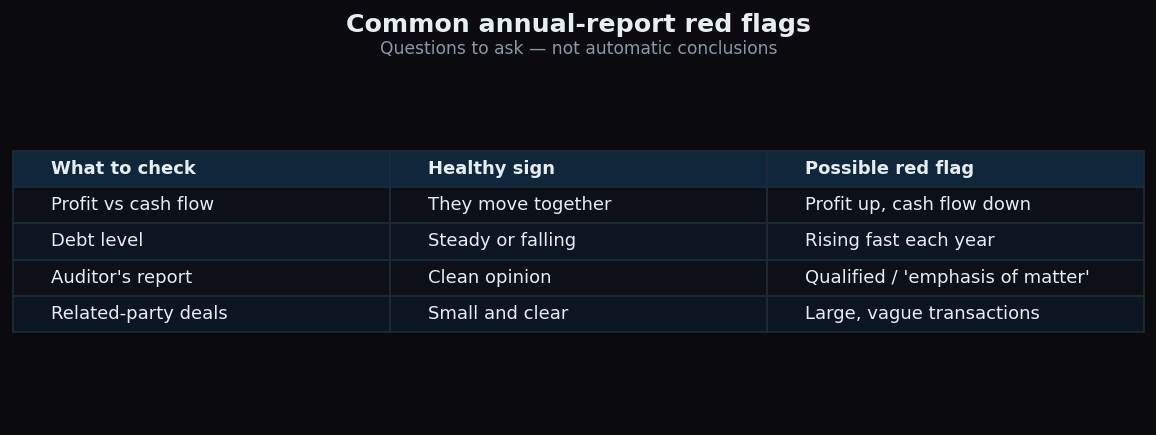
None of these is proof of trouble on its own. Each is a question to ask, a place to slow down and read more.
- Profit up but cash flow down. If reported profit keeps rising while cash from operations falls, the profit may be on paper only. Healthy profit usually turns into healthy cash. A persistent gap deserves an explanation.
- Debt climbing fast. A little debt is normal. Debt rising sharply year after year, especially faster than profit, raises the risk that interest payments will squeeze the business.
- A qualified auditor's opinion. A clean ("unqualified") opinion is what you want. Phrases like "qualified opinion" or "emphasis of matter" mean the auditor is flagging something — read exactly what.
- Large or vague related-party transactions. Deals between the company and its own owners or their other businesses can be perfectly fine — or a way to move money around. Big, unclear ones deserve scrutiny.
- The story and the numbers disagree. If the letter is euphoric but revenue and margins are sliding, trust the numbers.
A worked example
Suppose Sunrise Foods reports net profit up from ₹40 crore to ₹50 crore — a cheerful headline. But in the cash flow statement, cash from operations fell from ₹45 crore to ₹20 crore, and the notes show debt jumped from ₹100 crore to ₹180 crore. The headline says "record profit"; the fine print says "profit is not becoming cash and borrowing is rising." You would not conclude anything final — you would simply know which questions to ask next. That is the whole skill.
The honest catch
Reading an annual report has real limits. It is historical — it describes a year that has already ended, and the future can look very different. It is written partly by people who want to look good, so the prose leans optimistic. And accounting has genuine grey areas: two honest firms can present similar realities in different-looking numbers. So treat the report as one strong source of evidence, not the final word. Combine it with the industry backdrop and a few years of history, and never lean on a single line.
Want to turn dense reports into clear questions you can actually answer? TrueTrend's beginner-friendly education and market tools break the jargon down piece by piece. Create a free account and start reading the market with confidence.
Key takeaways
- An annual report is a company's yearly update to shareholders — part story from management, part audited numbers.
- Read in order: chairman's letter, then MD&A, then the financial statements, then the notes and auditor's report.
- The income statement simply peels costs away from revenue, layer by layer, down to net profit.
- Watch for red flags: profit rising while cash falls, debt climbing fast, a qualified audit opinion, and vague related-party deals.
- Every red flag is a question to investigate, not an automatic conclusion.
- The report is historical and partly promotional — use it with industry context and several years of history.
See these concepts on live market data — free
Create a free TrueTrend account to watch daily support/resistance levels, market regime, and option-positioning charts on NIFTY, BankNifty and 12 more instruments. Every level we publish is scored on a public scoreboard — misses included. No card required.
Free forever tier · daily levels with published hit-rates across every instrument. Descriptive market structure, not investment advice.
Not ready for an account? Get the daily levels by email.
One short email each market day — the indices' call wall, put wall, gamma flip and max pain, and how the last session's levels scored. Free, no account, unsubscribe anytime.
Descriptive market structure, not investment advice. We never share your email.