India VIX Explained: The Market Fear Index
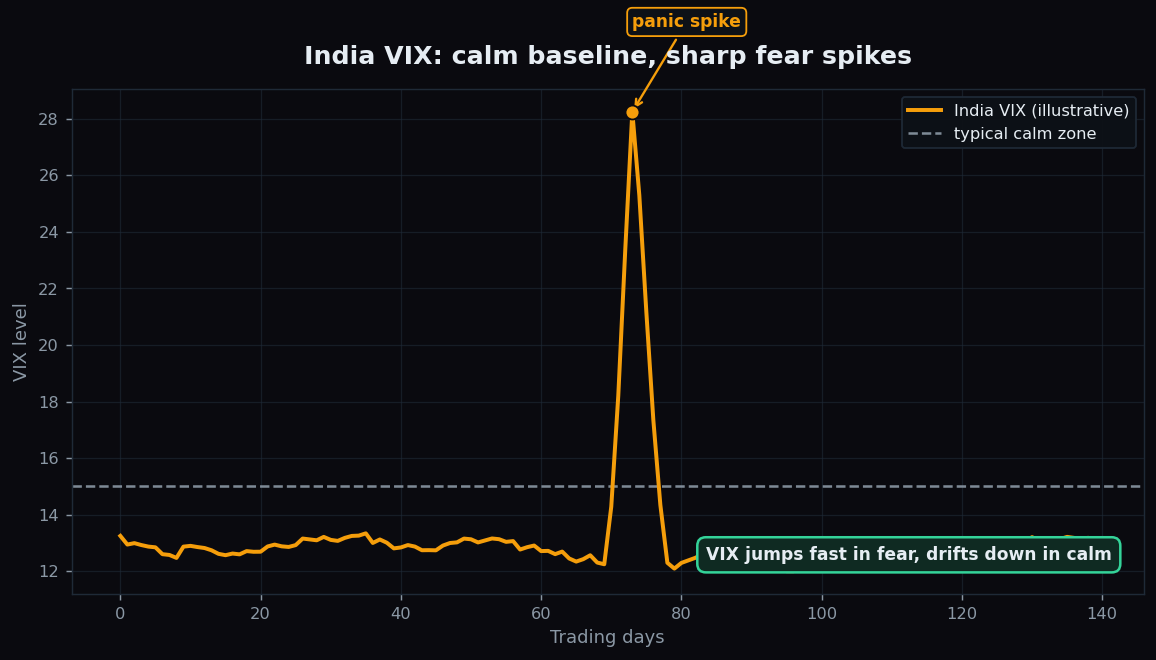
When markets get scary, one number on the screen tends to leap while everything else falls: the India VIX. Traders nickname it the “fear index,” and it captures something the price charts do not — how nervous the market expects the near future to be. This post explains what the VIX measures, why it spikes in a panic, and how to read it, using simple, made-up numbers.
What the India VIX is
The India VIX is a single number, published by the exchange, that estimates how much the Nifty is expected to swing over roughly the next 30 days. It is quoted as an annualised percentage. A reading of, say, 14 is calm; a reading of 30 signals a jittery, fearful market.
Crucially, the VIX is not built from past prices. It is calculated from the prices of Nifty options — contracts that let people protect against, or bet on, market moves. When investors grow anxious, they rush to buy this protection, which pushes option prices up. The VIX reads those richer option prices and reports back: “the crowd is bracing for bigger swings.”
That is why the VIX is called a measure of implied volatility. Volatility means the size of price swings. Implied means it is inferred from what people are paying today for option protection — a forward-looking guess, not a rear-view mirror.
An everyday analogy
Think of the VIX as the price of umbrellas in a town. On a clear day, umbrellas are cheap and few people carry them — the “umbrella index” is low. The moment dark clouds gather, everyone wants an umbrella at once, and the price jumps. The high price does not cause the storm, and it does not promise one will hit — it simply reflects how worried people are about getting soaked. The VIX is the umbrella price for the stock market.
Why it spikes during fear
Notice the shape in the chart above. The VIX tends to drift down slowly during calm, rising markets, then spike violently when fear hits. This asymmetry — slow down-drift in calm, sudden jump in panic — is one of its defining traits. It is often said that the VIX “takes the elevator up and the stairs down” in a scare, meaning fear arrives fast and fades slowly.
This is also why the VIX usually moves opposite to the market. When the Nifty falls hard, demand for downside protection surges, option prices balloon, and the VIX shoots up. When markets are grinding calmly higher, protection is cheap and the VIX sinks. So a rising VIX generally lines up with a falling, nervous market.
How a VIX level translates into an expected range
The VIX is quoted per year, but market swings compound over time, so to get a shorter-term range you scale it down by the square root of time. The rough rule: divide the annual VIX by about 3.5 to approximate a one-month expected move, or by about 16 for a rough one-day move (since there are roughly 250 trading days in a year and the square root of 250 is about 16).
A worked example with round numbers. Suppose the Nifty is at 20,000 and the India VIX is 14.
- One-month rough move: 14 ÷ 3.5 = 4%. So the market is implying a swing of about ±4% over the next month — roughly ±800 points, i.e. a band from about 19,200 to 20,800.
- One-day rough move: 14 ÷ 16 ≈ 0.9%. That is about ±180 points on a typical day.
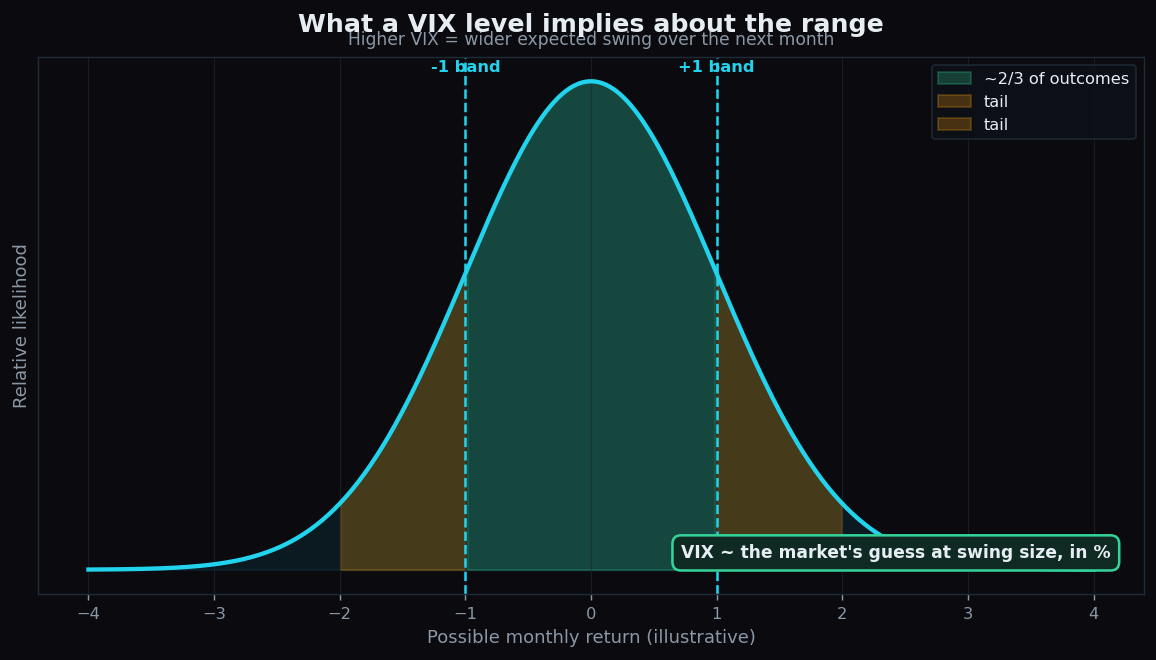
Now imagine fear strikes and the VIX jumps to 28. The one-month implied swing doubles to about ±8%, or ±1,600 points. Same index, but the market is now bracing for twice the turbulence. The bell-curve picture below shows how a higher VIX simply widens the expected range of outcomes.
The honest catch
The VIX is a genuinely useful mood gauge, but it is widely misunderstood. Keep these limits in mind:
- It shows size, not direction. A high VIX says “expect big moves,” not “the market will fall.” Swings can be large in either direction, even if fear usually accompanies drops.
- It is an estimate, not a promise. The implied range is a probability, not a boundary. Actual moves can land well inside or far outside it.
- Extremes are noisy. A very high VIX often marks peak panic, which historically has clustered near turning points — but “often” is not “always,” and it is no timing tool.
- It is context, not a signal. Reading the VIX tells you the market's current temperature. It is not a nudge to do anything, and the numbers here are illustrative.
Because fear frequently arrives from overseas, the VIX often jumps on global shocks. If you want to see how that overnight nervousness travels into our market, our note on global cues and Indian markets is a natural next read.
Curious how today's fear gauge fits with the rest of the market picture? TrueTrend brings volatility context into one clean, beginner-friendly view. Create a free account to explore it.
Key takeaways
- The India VIX estimates the Nifty's expected swing over the next ~30 days, read from option prices (implied volatility).
- It spikes in fear and drifts down in calm, usually moving opposite to the market.
- Divide the VIX by ~3.5 for a rough monthly range or ~16 for a daily one — a VIX of 14 on a 20,000 Nifty implies about ±4% a month.
- It signals the size of expected moves, not their direction — it is a mood gauge, not a forecast or a signal to act.
See these concepts on live market data — free
Create a free TrueTrend account to watch daily support/resistance levels, market regime, and option-positioning charts on NIFTY, BankNifty and 12 more instruments. Every level we publish is scored on a public scoreboard — misses included. No card required.
Free forever tier · daily levels with published hit-rates across every instrument. Descriptive market structure, not investment advice.
Not ready for an account? Get the daily levels by email.
One short email each market day — the indices' call wall, put wall, gamma flip and max pain, and how the last session's levels scored. Free, no account, unsubscribe anytime.
Descriptive market structure, not investment advice. We never share your email.