How Interest Rates Affect Stock Markets
You will often hear that a central bank “raised rates” and that stocks wobbled in response. It sounds abstract, but the link is surprisingly logical once you see it. Interest rates are the price of money, and when that price changes, the value of nearly everything else — including shares — quietly gets repriced. This post walks through the connection in plain language, with round-number examples.
What an interest rate really is
An interest rate is simply the rent charged on borrowed money. The most important one is set by the country's central bank (in India, the Reserve Bank of India). This is the policy rate — the benchmark that ripples out to the rates on home loans, business loans, and the returns on safe deposits and government bonds.
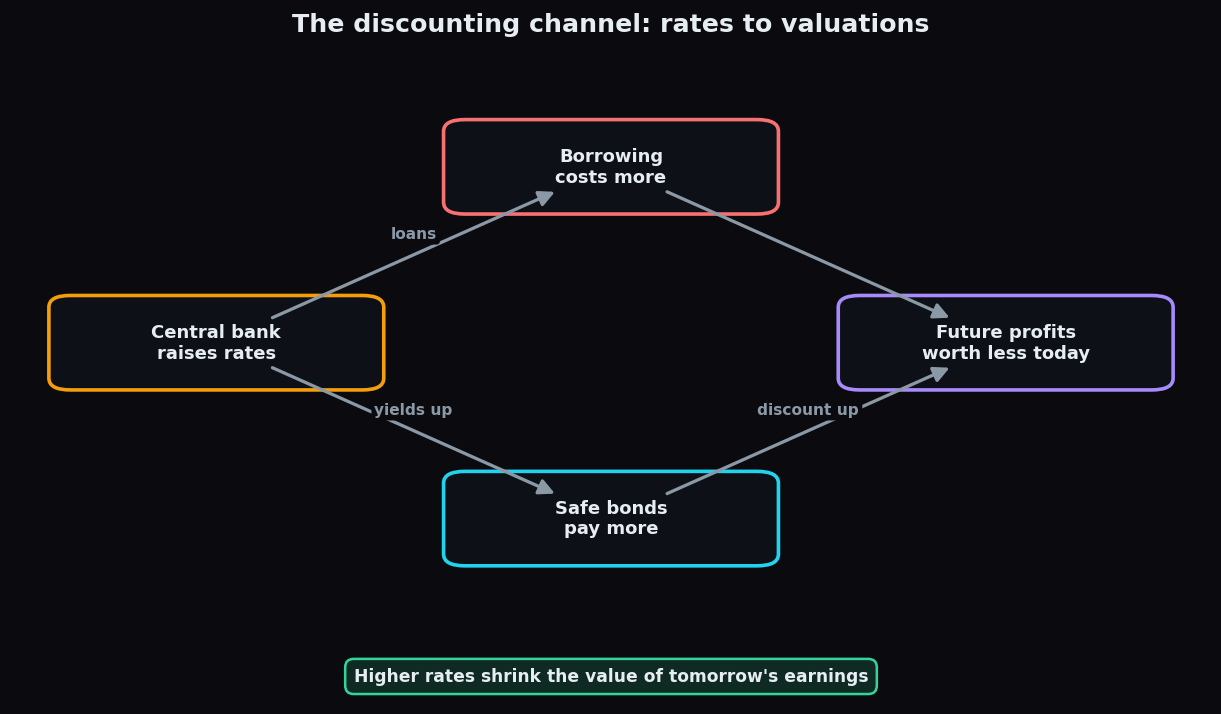
When the central bank raises the policy rate, borrowing gets more expensive and safe savings pay more. When it cuts the rate, borrowing gets cheaper and safe savings pay less. That single lever nudges the whole economy — and the stock market feels it through two main channels.
Channel one: the cost of doing business
Most companies borrow. They take loans to build factories, stock inventory, and fund growth. When rates rise, the interest they pay rises too, so more of their revenue goes to lenders and less becomes profit. Households feel it as well: costlier home and car loans leave families with less to spend, which softens demand for the companies' products.
So higher rates tend to squeeze profits from both ends — higher costs and cooler demand. Lower rates do the reverse: cheaper money can lift both spending and profits.
Channel two: the discounting channel (the big one)
This is the channel that surprises beginners, so let us slow down. A share is worth the company's future profits — earnings that will arrive over many years to come. But money in the future is worth less than money today, and rates decide how much less.
Discounting is the act of shrinking a future rupee to its value today. If the safe rate of return is high, you would only pay a little now for a rupee arriving years later — because you could instead earn that high rate risk-free. If the safe rate is low, that same future rupee is worth much more to you today.
An everyday analogy: imagine a fruit-seller pricing a mango that will only ripen next year. If storing cash earns a fat 10% a year, she will not pay much today for a future mango — she would rather keep her cash earning interest. If cash earns almost nothing, she will happily pay closer to full price now. Shares are that future mango, and the interest rate is what her cash earns while she waits.
Why valuations compress when rates rise
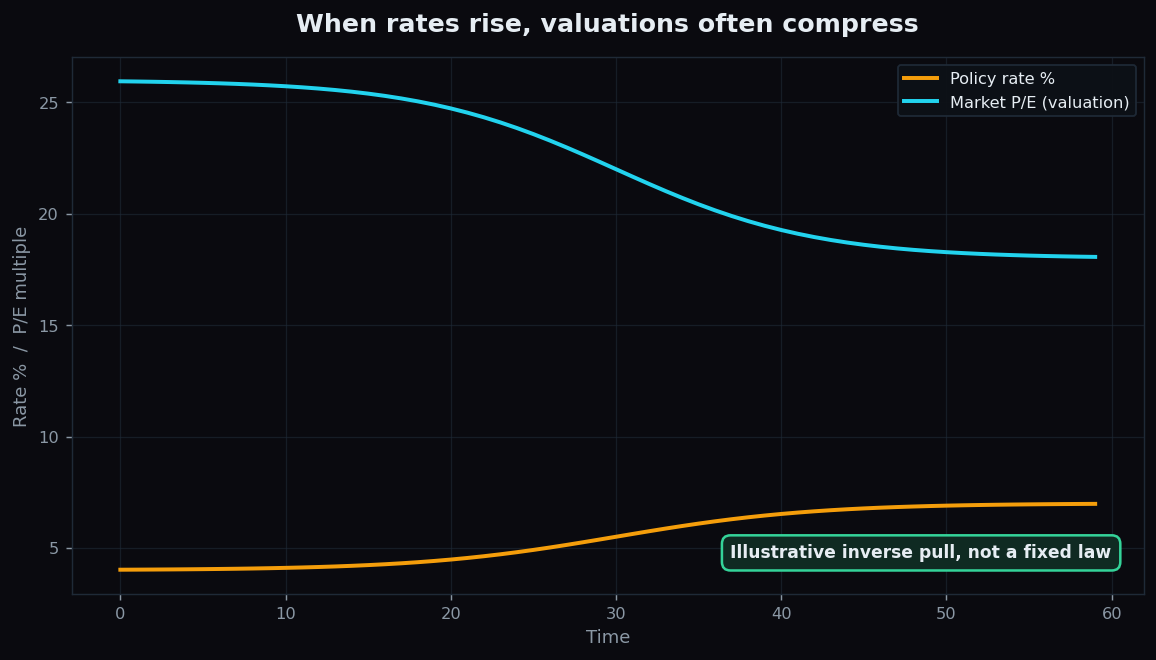
Put the two channels together and you get the headline effect: when rates rise, valuations tend to fall, and vice versa. “Valuation” here means how many rupees investors will pay for each rupee of a company's earnings — captured by the P/E ratio (price divided by earnings per share).
A worked example with round numbers. Suppose a company earns ₹10 per share. In a low-rate world investors happily pay a P/E of 25, so the share trades at ₹250. Now rates climb, safe bonds start paying meaningfully more, and future earnings get discounted harder. Investors are no longer willing to pay 25 — they will only pay a P/E of 18. Even if the company's ₹10 earnings have not changed at all, the share is now worth 18 × ₹10 = ₹180. The stock fell 28% purely because the value of its future was repriced, not because the business got worse.
Not every sector feels it equally
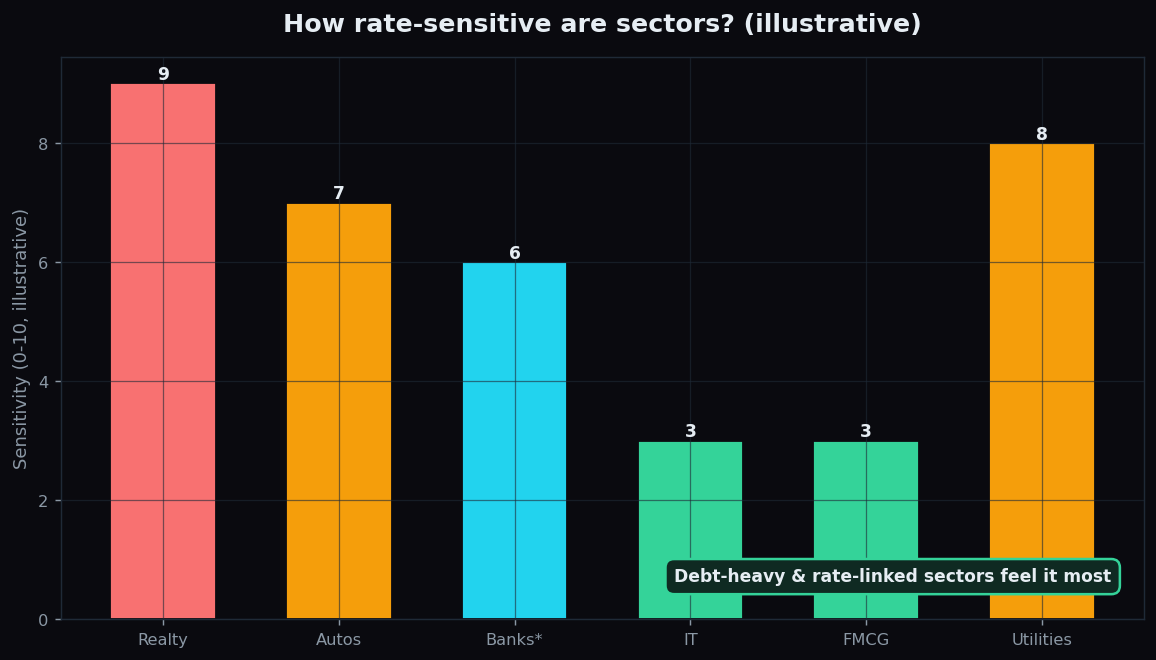
Rates hit some corners harder than others:
- Debt-heavy and rate-linked sectors — such as real estate, autos, and infrastructure — tend to be the most sensitive, because their customers usually buy on loans and the firms themselves carry a lot of debt.
- Banks and lenders are a mixed case: higher rates can widen the gap between what they earn on loans and pay on deposits, but can also slow borrowing. The net effect varies.
- Steady, cash-rich, low-debt businesses — think everyday consumer staples or utilities with reliable demand — usually swing less on rate moves.
- High-growth companies whose profits sit far in the future are especially exposed to the discounting channel, because more of their value depends on distant earnings.
The honest catch
The rate-versus-stocks link is a tendency, not a law you can set your watch by:
- Expectations matter more than the move itself. Markets usually price in a hike or cut before it happens. A widely expected rate rise can pass with barely a flicker, while a surprise of the same size jolts prices.
- Many forces pull at once. Earnings growth, global flows, currency, and oil can easily overwhelm the rate effect in the short run. Stocks sometimes rise into a rate-hiking cycle because growth is strong.
- The examples here are illustrative. Real P/E shifts are messier and never move on rates alone.
Because rates also drive the returns on safe bonds, they sit at the heart of how money rotates between assets. Our companion note on global cues and Indian markets shows how overseas rate moves reach our screens overnight.
Rates, valuations, and market mood are easier to follow when they are laid out simply. TrueTrend translates this kind of market context into plain-English dashboards. Start free and see the bigger picture at a glance.
Key takeaways
- An interest rate is the price of money; the central bank's policy rate ripples through the whole economy.
- Higher rates hurt stocks two ways: costlier business borrowing and, crucially, harder discounting of future profits.
- The discounting channel can lower a share's price even when its earnings are unchanged — valuations simply compress.
- Debt-heavy sectors feel rates most; the link is a tendency, and expectations often matter more than the actual move.
See these concepts on live market data — free
Create a free TrueTrend account to watch daily support/resistance levels, market regime, and option-positioning charts on NIFTY, BankNifty and 12 more instruments. Every level we publish is scored on a public scoreboard — misses included. No card required.
Free forever tier · daily levels with published hit-rates across every instrument. Descriptive market structure, not investment advice.
Not ready for an account? Get the daily levels by email.
One short email each market day — the indices' call wall, put wall, gamma flip and max pain, and how the last session's levels scored. Free, no account, unsubscribe anytime.
Descriptive market structure, not investment advice. We never share your email.