Inventory and Receivables Red Flags: When Growing Sales Hide Trouble
A company reports sales up 50%. The story writes itself: demand is booming, the business is flying. But look one line lower in the accounts. The money customers still owe the company has tripled in the same period, and the warehouse is fuller than ever. That is not growth arriving in the bank — it is growth on paper, waiting to be collected. Two ordinary balance-sheet items, receivables and inventory, often reveal this early, and reading them needs nothing more than school-level division.
The idea in one line (and a lemonade stand)
Revenue is a promise. Cash is proof. When sales grow but receivables and inventory grow much faster, the promise part is growing faster than the proof part.
Picture a lemonade stand. On Monday you hand out 10 cups and collect Rs 100 in coins. On Tuesday you hand out 20 cups, but 15 friends say “pay you tomorrow.” Your notebook says sales doubled. Your cash box says you earned less than Monday. Meanwhile, you squeezed 50 extra lemons that nobody wanted, and they are slowly going bad in the fridge. The notebook looks wonderful. The stand is in trouble. Listed companies can end up in exactly this position — just with more zeros.
What are receivables and inventory?
Two quick definitions, because everything below depends on them:
- Trade receivables (also called debtors): money customers owe the company for goods already delivered. The sale is recorded as revenue immediately, even though the cash arrives later. Receivables are IOUs sitting on the balance sheet.
- Inventory: raw materials, half-finished goods and finished products the company holds. It is money already spent, sitting on shelves, that only turns back into cash when someone pays for the product.
Both are normal. Every business that lets customers pay later has receivables; every manufacturer holds stock. The red flag is never their existence — it is their speed of growth compared with sales.
A worked example: the DSO check
Days Sales Outstanding (DSO) answers a simple question: on average, how many days does the company wait to collect cash after recording a sale? The formula:
DSO = (receivables ÷ annual sales) × 365
Take a furniture maker with simple round numbers:
- Year 1: sales Rs 100 crore, receivables Rs 20 crore. DSO = (20 ÷ 100) × 365 = 73 days. Customers pay in about two and a half months. Reasonable.
- Year 4: sales Rs 200 crore, receivables Rs 80 crore. DSO = (80 ÷ 200) × 365 = 146 days. Now the wait is almost five months.
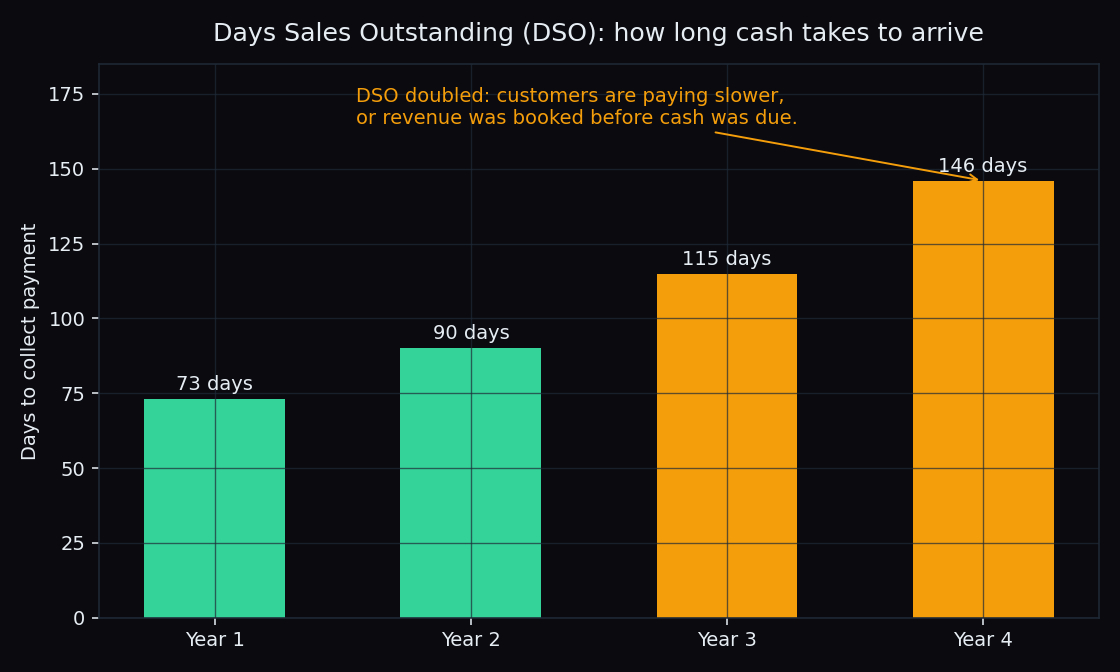
Sales doubled — the headline looks great. But DSO also doubled, which means each rupee of sales is taking twice as long to become real money. Only two things cause that: customers genuinely paying slower (a business-health problem), or revenue being recorded more aggressively than before (an accounting-quality problem). Neither is good news, and the headline growth number shows neither.
When receivables outrun sales
The single most useful habit: compare the growth rate of receivables with the growth rate of sales over three to four years. In a steady business they should move roughly together.
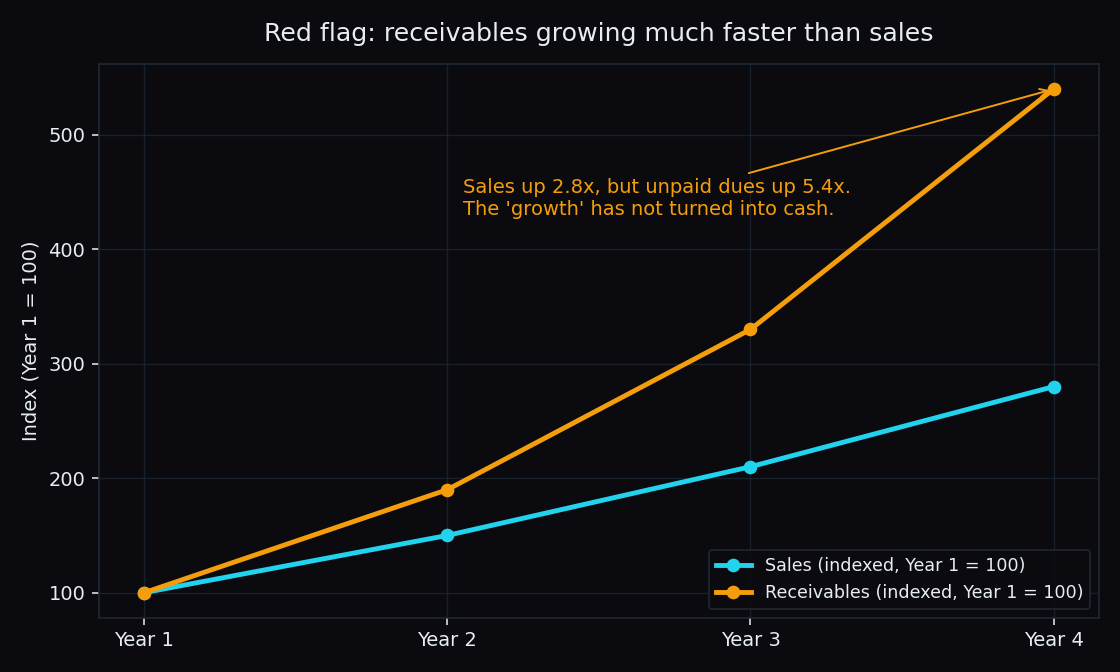
In the illustration above (synthetic numbers, drawn only to show the shape), sales rise 2.8 times over four years while receivables rise 5.4 times. A persistent gap like that has a few common explanations:
- Loosened credit terms. The company “grows” by letting customers pay much later. Sales are real but low-quality — some of that money may never arrive.
- Channel stuffing. Near quarter-end, the company pushes far more stock to its distributors than end demand supports, records it all as revenue, and the goods sit unpaid in someone else’s warehouse. Next quarter often starts with returns.
- Recording revenue early. Booking a sale before delivery is truly complete inflates both sales and receivables together, with no cash to show for it.
One bad year can be noise. Three years of receivables growing far ahead of sales is a pattern, and patterns are what forensic analysts read first.
Inventory red flags
Inventory has its own version of DSO: inventory days = (inventory ÷ cost of goods) × 365 — roughly how long stock sits before it moves. If a company holds Rs 25 crore of stock against Rs 75 crore of annual cost of goods, inventory days = (25 ÷ 75) × 365 = about 122 days: four months of stock on the shelves.
Watch for these patterns:
- Inventory days climbing while sales “grow.” If demand were truly strong, stock should be flying off shelves, not piling up. Rising stock plus rising sales can mean production is running ahead of real demand.
- Finished goods piling up fastest. A build-up of raw material can be strategic (locking in cheap input prices). A build-up of finished goods usually means products are not moving.
- Sudden large write-offs. When management finally admits stock is obsolete or unusable, years of overstated inventory hit the profit line in one painful quarter.
The cash-flow cross-check
Here is the beautiful part: you do not have to guess. The cash flow statement settles the argument. Profit is an opinion shaped by accounting choices; cash flow from operations (CFO) counts the actual money that moved. When receivables and inventory swell, they eat cash — and CFO quietly sinks even as reported profit climbs.
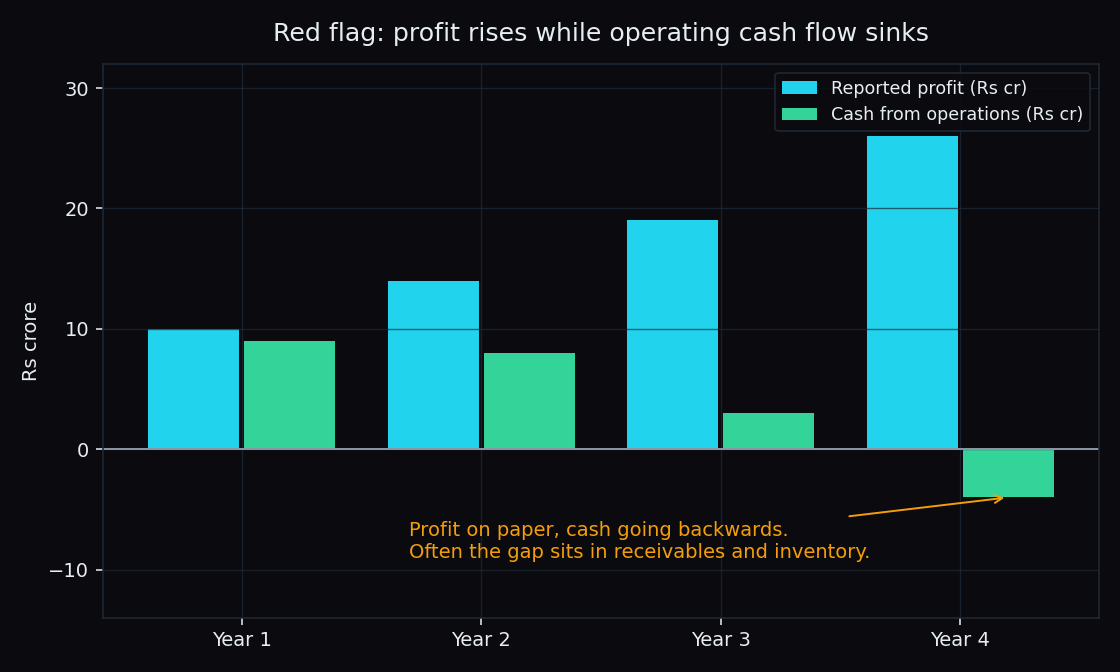
In the illustration, profit marches from Rs 10 crore to Rs 26 crore while operating cash flow slides from Rs 9 crore to below zero. A company can report rising profit with negative operating cash flow for a while — but not forever, because salaries, suppliers and lenders are paid in cash, not in accounting entries. India has seen this lesson written large: in the Satyam episode of January 2009, the company’s founder admitted that cash and bank balances shown in the accounts had been overstated by several thousand crore rupees. Numbers on a balance sheet are claims, not certainties — the cash-flow cross-check exists precisely because claims and reality can drift apart.
Key takeaway: growth in sales is only as good as the cash behind it. If receivables and inventory keep growing faster than sales, and operating cash flow keeps lagging profit, the income statement is telling a happier story than the bank account.
The honest catch
None of these signals is proof of wrongdoing on its own, and pretending otherwise is how people misread perfectly healthy companies:
- Some industries run on long credit. Infrastructure and capital-goods firms routinely wait months for payment; their DSO is naturally high. Compare a company with its own history and its industry peers, never with a universal “good” number.
- Seasonality distorts snapshots. A festival-season stock build-up in September is planning, not a red flag. Look at the same quarter year over year.
- Deliberate strategy exists. A company entering a new region may consciously extend credit to win customers. The difference is that management says so openly and the gap closes within a few quarters.
- One ratio is never a verdict. These checks tell you where to dig, not what to conclude. They narrow your attention; they do not replace reading the annual report, the auditor’s notes and the cash flow statement in full.
The habit worth keeping is small: every time a sales-growth headline impresses you, spend sixty seconds checking whether receivables, inventory and operating cash flow grew in a way that supports the story. Most of the time they will. The times they do not are exactly the times the headline matters least.
Reading one company’s accounts takes an evening. Reading the whole market’s positioning takes a system. TrueTrend turns Nifty, Bank Nifty and F&O market structure into a clear, at-a-glance read — and scores its own track record in public. Create a free account to see it.
See these concepts on live market data — free
Create a free TrueTrend account to watch daily support/resistance levels, market regime, and option-positioning charts on NIFTY, BankNifty and 12 more instruments. Every level we publish is scored on a public scoreboard — misses included. No card required.
Free forever tier · daily levels with published hit-rates across every instrument. Descriptive market structure, not investment advice.
Not ready for an account? Get the daily levels by email.
One short email each market day — the indices' call wall, put wall, gamma flip and max pain, and how the last session's levels scored. Free, no account, unsubscribe anytime.
Descriptive market structure, not investment advice. We never share your email.