Market Cap vs Enterprise Value: The Real Price Tag
Ask a beginner “how big is that company?” and most will reach for one number: the share price times the number of shares. That is the market capitalisation, and it is a useful start. But if you were actually buying the whole business, the price on the tag would not be the price you pay. To capture that fuller figure, analysts use enterprise value. Understanding the difference is one of the cleanest “aha” moments in fundamental analysis.
Market capitalisation: the equity price tag
Market cap is simply the total value the stock market places on a company’s shares:
Market cap = share price × number of shares outstanding.
If a company has 10 crore shares trading at ₹80 each, its market cap is ₹800 crore. This tells you what all the owners’ stakes are worth combined. It is the value of the equity — the slice that belongs to shareholders after everyone else is paid.
That last phrase is the whole point. Shareholders sit at the back of the queue. Before they own anything, the company’s lenders have a claim. So market cap answers “what is the equity worth?” — not “what would the whole business cost?”
The house-with-a-loan analogy
Imagine buying a flat listed at ₹80 lakh. But the flat carries an outstanding home loan of ₹20 lakh that you must take over, and taped inside a kitchen drawer is ₹10 lakh in cash that comes with the sale. What does the flat truly cost you?
- You pay the ₹80 lakh sticker price to the owner.
- You inherit the ₹20 lakh loan, so add that.
- You pocket the ₹10 lakh cash, so subtract that.
Your real, all-in cost is 80 + 20 − 10 = ₹90 lakh. That all-in number is exactly what enterprise value measures for a company.
Enterprise value: the takeover price
Enterprise value (EV) is what it would cost to buy the entire business, debt and all:
EV = market cap + total debt − cash & equivalents.
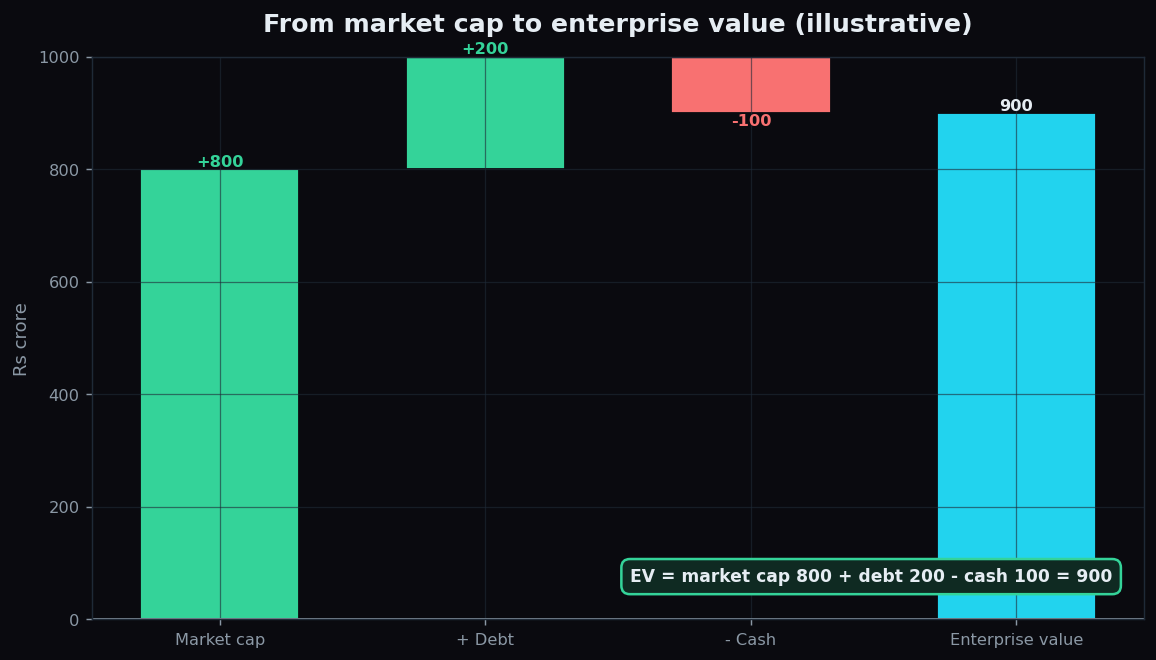
The chart walks through an illustrative case. Start with a market cap of ₹800 crore. The company owes ₹200 crore in debt, which an acquirer would have to repay or assume, so add it. It also holds ₹100 crore in cash, which the acquirer effectively gets back, so subtract it. Enterprise value is 800 + 200 − 100 = ₹900 crore. (All numbers here are round and fictional, purely to show the mechanics.)
Why add debt? Because a buyer cannot ignore it — the loans come with the company and must be serviced or settled. Why subtract cash? Because the moment you own the business you own its cash too, which reduces the effective price. This is why two companies with identical market caps can have very different enterprise values: a debt-free firm sitting on cash is genuinely cheaper to acquire than a debt-laden one.
Market cap vs enterprise value at a glance
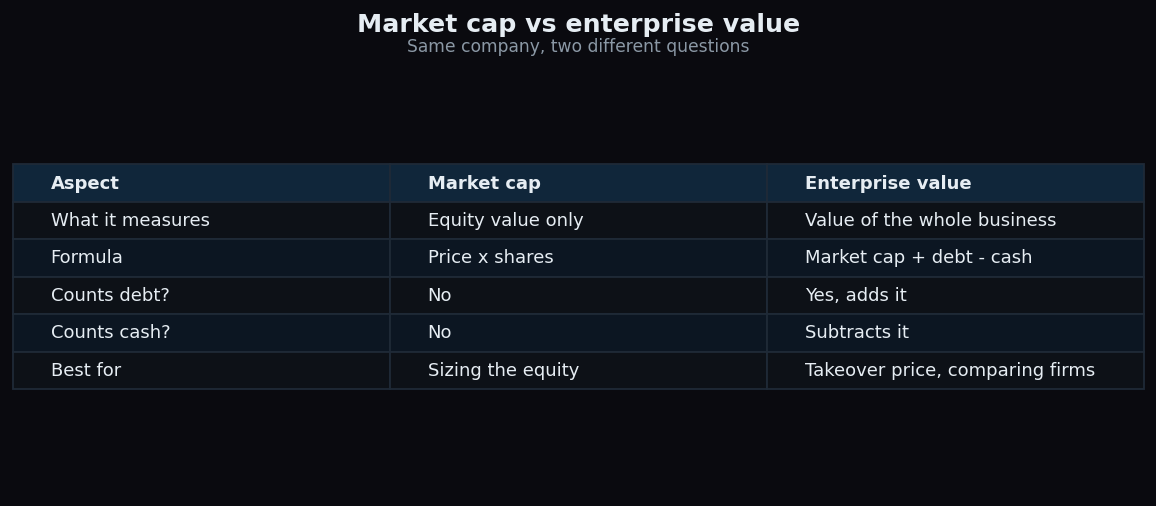
The two numbers answer different questions, so they suit different jobs. Market cap sizes the equity: it is the figure behind terms like large-cap, mid-cap and small-cap, and it is what index weights are usually based on. Enterprise value sizes the whole business, which is why it appears in takeover discussions and in valuation ratios that need a like-for-like comparison.
How investors use enterprise value
The most common use is in ratios that compare companies fairly. A popular one is EV divided by EBITDA (earnings before interest, tax, depreciation and amortisation — a rough proxy for operating cash generation). Because EV already accounts for debt and cash, it lets you line up a heavily borrowed company against a debt-free one on more even footing than a price-to-earnings ratio would.
A quick illustration: two firms both earn ₹100 crore of EBITDA. Firm A has an EV of ₹900 crore, so its EV/EBITDA is 9. Firm B has an EV of ₹1,200 crore, so its ratio is 12. On this single measure, the market is paying more per rupee of operating profit for Firm B — a starting point for asking why, not a conclusion on its own.
The honest catch
Enterprise value is fuller, but it is not flawless. Balance-sheet cash and debt are snapshots from one day and can be managed around reporting dates. “Debt” can be defined narrowly or broadly — some analysts also add items such as minority interests or lease obligations, so two people can calculate slightly different EVs for the same company. And not all cash is truly spare; some is needed just to run the business. As always, EV is a tool for comparison and questions, not a verdict by itself.
Grasping the gap between the equity price and the whole-business price is the kind of foundation that makes every other ratio click into place. To keep learning market mechanics in plain language, you can explore TrueTrend by creating a free account.
Key takeaways
- Market cap = share price × shares — the value of the equity alone.
- Enterprise value = market cap + debt − cash — the fuller cost of buying the whole business.
- Add debt because a buyer inherits it; subtract cash because a buyer effectively gets it back.
- Two firms with the same market cap can have very different enterprise values depending on their debt and cash.
- EV powers fairer comparison ratios like EV/EBITDA, but definitions vary and balance-sheet figures are single-day snapshots.
See these concepts on live market data — free
Create a free TrueTrend account to watch daily support/resistance levels, market regime, and option-positioning charts on NIFTY, BankNifty and 12 more instruments. Every level we publish is scored on a public scoreboard — misses included. No card required.
Free forever tier · daily levels with published hit-rates across every instrument. Descriptive market structure, not investment advice.
Not ready for an account? Get the daily levels by email.
One short email each market day — the indices' call wall, put wall, gamma flip and max pain, and how the last session's levels scored. Free, no account, unsubscribe anytime.
Descriptive market structure, not investment advice. We never share your email.