Morning Star and Evening Star Candlestick Patterns
Some of the most quoted candlestick signals come in threes. The morning star and the evening star are matched three-candle patterns that try to capture the exact moment a market loses its nerve — a bottom turning up, or a top rolling over. They are popular because the shape tells a tidy little story you can read at a glance. They are also widely misused, so it is worth understanding both the story and its limits.
A quick refresher on candles
Each candlestick packs four prices from one period into one shape: the open (where it started), the close (where it ended), and the high and low (the extremes). The thick part is the body, drawn between open and close; the thin lines above and below are the wicks. A long body means one side dominated all period; a tiny body means buyers and sellers fought to a near-draw. That tiny body is the key to both star patterns.
The morning star: a three-candle bottom
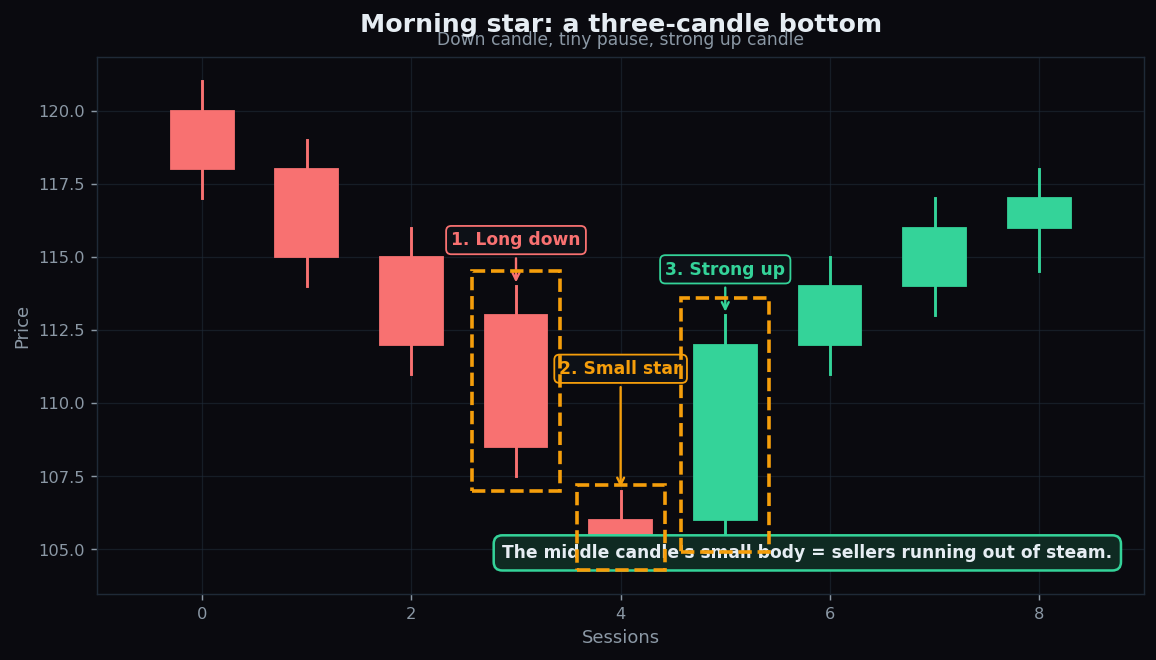
A morning star forms after a decline and is read as a possible shift from falling to rising. It has three parts, in order:
- A long down candle. Sellers are firmly in charge and the downtrend looks healthy.
- A small-bodied candle (the “star”). It often gaps lower but then goes almost nowhere — a tiny body. This is the heart of the pattern: the relentless selling has suddenly stalled into indecision.
- A long up candle. Buyers take over and push price back up well into the body of that first down candle.
The name is poetic but apt: like the morning star appearing before dawn, the small middle candle is the first hint that the dark stretch may be ending. The story is strong selling → sellers run out of steam → buyers respond.
The evening star: a three-candle top
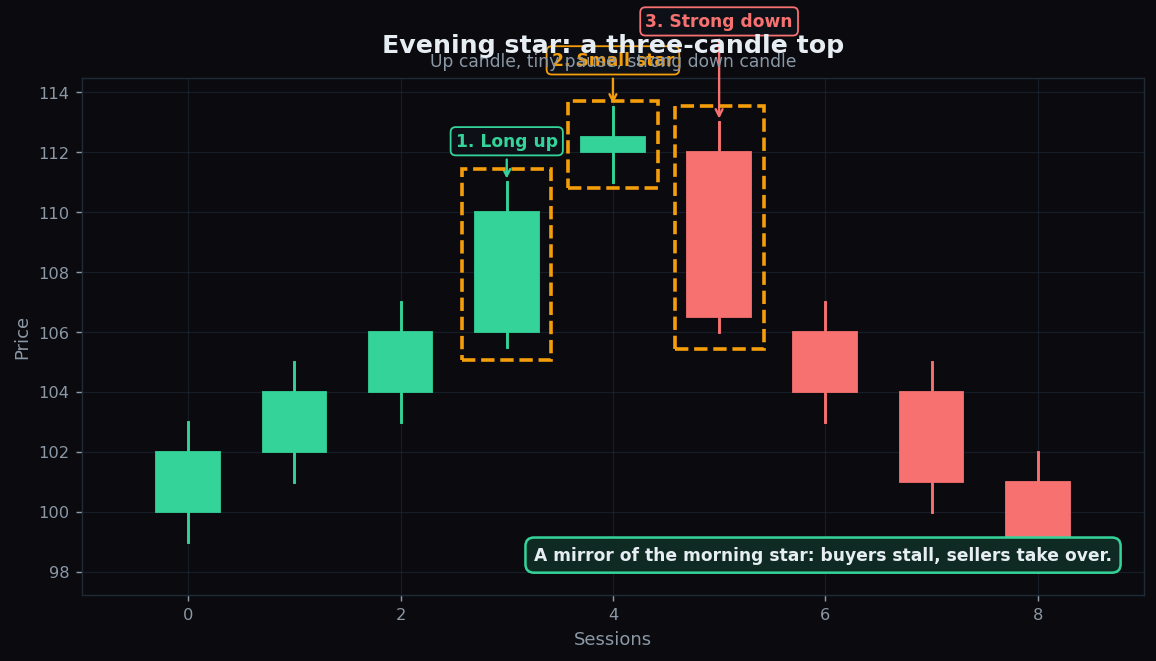
The evening star is the exact mirror image, forming after a rally and read as a possible shift from rising to falling. Its three parts:
- A long up candle. Buyers are firmly in charge and the uptrend looks healthy.
- A small-bodied candle (the star). It often gaps higher but then stalls into a tiny body — the buying has run into indecision.
- A long down candle. Sellers take over and push price back down well into the body of that first up candle.
Here the story flips: strong buying → buyers run out of steam → sellers respond. The evening star is named for the star that appears at dusk, just before night — a warning that the bright run may be fading.
Why the small middle candle matters
Both patterns hinge on that second candle. In a strong trend, candles tend to have long bodies in the trend’s direction — one side keeps winning. A sudden tiny body means the winning side could not push price away from where it opened. The tug-of-war has become a stalemate.
Think of a heavy door someone has been shoving open. As long as it keeps swinging fast, the pusher is winning. The moment the door barely moves — that is the small candle — you suspect the pusher is tiring. The third candle is the door swinging back the other way as the other person leans in.
That is why a star pattern is taken more seriously when the middle candle is genuinely small and the third candle is genuinely strong, ideally closing deep into the first candle’s body. A half-hearted third candle leaves the story unfinished.
A worked example with round numbers
Picture a stock sliding lower, and watch a morning star build with clean numbers:
- Candle 1: opens at 113, closes at 108. A long 5-point red body — sellers dominate.
- Candle 2: opens at 106, closes at 105.5. A tiny half-point body that gapped down but then froze — the stall.
- Candle 3: opens at 106, closes at 112. A long 6-point green body that climbs back into candle 1’s range — buyers answer.
Across the three sessions the mood travelled from confident selling, to hesitation, to confident buying. That arc — not any single candle — is the morning star. An evening star runs the identical maths upside down: a +5 green, a flat star, then a −6 red giving the points back.
The honest catch
Star patterns are descriptive, not predictive, and they fail often. Keep these limits front of mind:
- Context decides everything. A morning star only means “possible bottom” if it appears after a real decline. The same three shapes in the middle of a sideways chop are just noise. Pattern without context is meaningless.
- They fail regularly. Plenty of textbook stars form and price simply keeps going the original way. The pattern raises a question; it does not answer it.
- Definitions are fuzzy. How small is “small”? How deep must candle three close? Different people draw the line differently, so the same chart can be a star to one viewer and not to another.
- Timeframe matters. A star on a weekly chart carries more weight than one on a 1-minute chart, where random twitches constantly mimic the shape.
- Many wait for confirmation. Because of all the above, chart-watchers often wait for the next candle to continue the new direction before trusting the pattern at all.
Treated as a vivid way to read crowd psychology shifting — rather than a button that prints money — the morning and evening star are genuinely useful additions to a beginner’s vocabulary.
Candlestick shapes are easier to trust once you can see how often a pattern actually plays out. TrueTrend turns raw market structure into plain-English context so you can study these signals with clear eyes — create a free account to explore.
Key takeaways
- The morning star (long down, small star, long up) is a three-candle pattern read as a possible bottom; the evening star is its mirror at a top.
- The small middle candle is the core idea — it shows the dominant side stalling into indecision.
- The third candle must confirm the reversal, ideally closing deep into the first candle’s body.
- Context is mandatory: the pattern only matters after a genuine trend, not inside sideways chop.
- Stars fail often and are loosely defined; treat them as a read on shifting psychology, never a guarantee.
See these concepts on live market data — free
Create a free TrueTrend account to watch daily support/resistance levels, market regime, and option-positioning charts on NIFTY, BankNifty and 12 more instruments. Every level we publish is scored on a public scoreboard — misses included. No card required.
Free forever tier · daily levels with published hit-rates across every instrument. Descriptive market structure, not investment advice.
Not ready for an account? Get the daily levels by email.
One short email each market day — the indices' call wall, put wall, gamma flip and max pain, and how the last session's levels scored. Free, no account, unsubscribe anytime.
Descriptive market structure, not investment advice. We never share your email.