Moving Averages Explained: Meaning, Strategies and Reliability
Ask ten traders for the one indicator they would keep, and a huge share will say the moving average. It's on every chart, in every strategy book, and behind famous signals like the "golden cross." Yet plenty of people use it without really understanding what it shows — or where it quietly fails.
This is a complete, plain-English guide: what moving averages are, the main types, how to read them, the strategies built on them, and an honest look at how reliable they really are.
What is a moving average?
A moving average (MA) is simply the average price over the last N periods, recalculated every period. As each new candle forms, the oldest price drops out of the window and the newest drops in — so the average "moves" along with price.
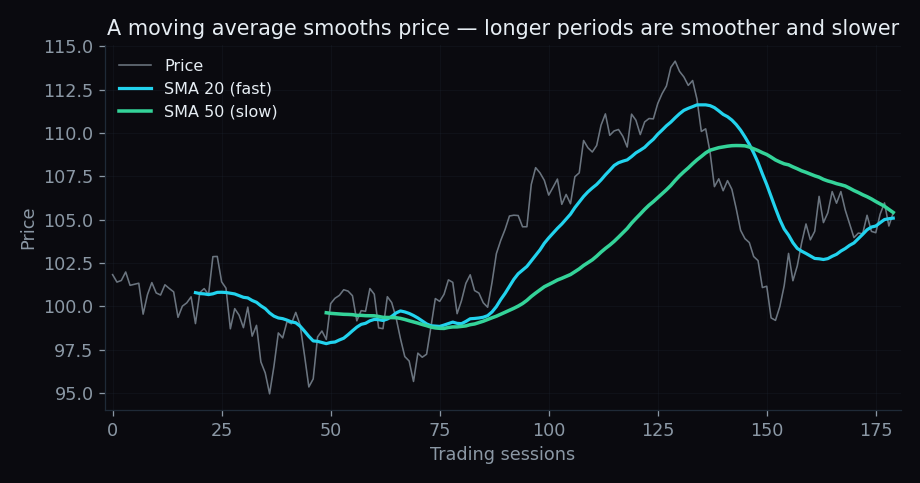
Its job is to smooth out the noise. Day-to-day price is jumpy; a moving average filters the random wiggles so the underlying direction is easier to see. The longer the period, the smoother the line — and the slower it reacts.
The main types: SMA, EMA and WMA
All moving averages smooth price, but they weight the past differently.
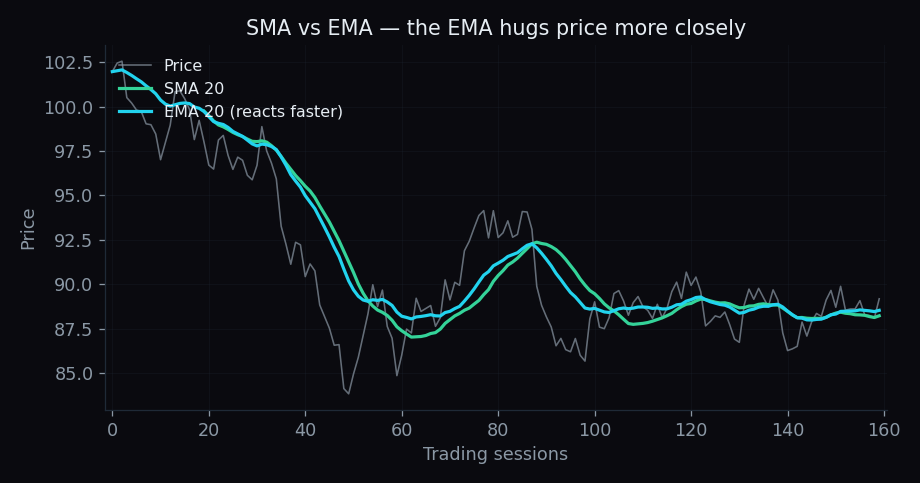
- Simple Moving Average (SMA): every period in the window counts equally. A 50-day SMA is just the average of the last 50 closes. Smooth and stable, but slow to turn.
- Exponential Moving Average (EMA): recent prices get more weight, so the line reacts faster to new moves. Popular with short-term traders who want earlier signals (at the cost of more false ones).
- Weighted Moving Average (WMA): also front-weights recent data, in a straight-line fashion — a middle ground that is less common than the EMA.
The trade-off is always the same: faster reaction means more responsiveness but more noise; slower reaction means smoother but later.
How to read a moving average
Once it's on the chart, a moving average tells you a few things at a glance:
- Trend direction: a rising MA means the average price is climbing (uptrend); a falling MA, a downtrend; a flat MA, a range.
- Price vs the line: price above the MA is generally read as bullish context; below it, bearish. The 200-day MA is widely used as the dividing line between long-term bull and bear regimes.
- Slope and separation: a steep MA signals strong momentum; MAs spreading apart show a strengthening trend, while MAs flattening and tangling show indecision.
How moving averages help
Used well, an MA does three practical jobs:
- It filters noise and defines the trend so you're not reacting to every random candle.
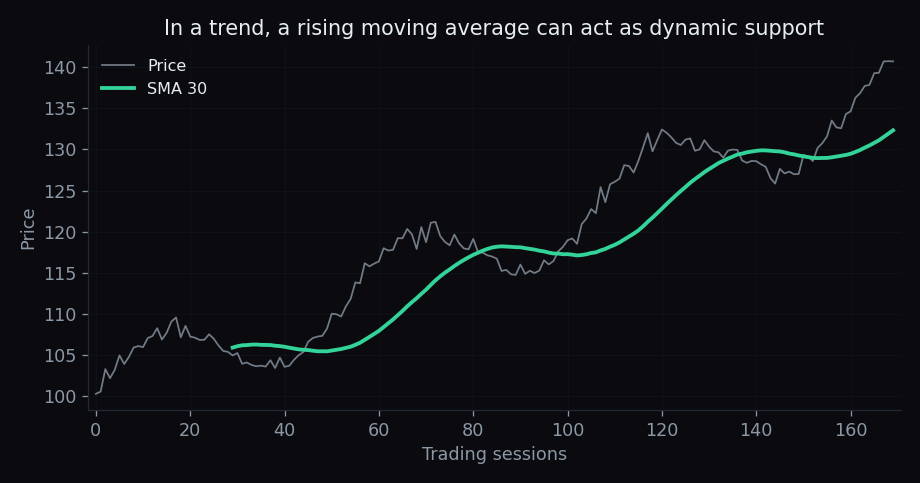
- It acts as dynamic support or resistance. In a healthy uptrend, price often pulls back to a rising MA and bounces; in a downtrend, a falling MA can cap rallies. Because the level moves with price, it adapts as the trend develops.
- It frames entries and exits in a rules-based way — for example, staying with a position while price holds above a chosen MA.
Are moving averages reliable?
Here's the honest part. Moving averages are useful, but they're not a crystal ball, and three limits matter:
- They lag — by design. An MA is built from past prices, so it always confirms a move after it has begun. You trade a turn late; that's the price of smoothing.
- They whipsaw in sideways markets. When price chops around a flat MA, crossover signals fire repeatedly and most are false. MAs shine in trends and struggle in ranges.
- They are period-dependent. A 50-day MA and a 21-day MA can disagree completely. It's easy to "find" a perfect MA on past data that fails going forward (curve-fitting).
One nuance in their favour: because so many traders watch the same round-number MAs (50, 100, 200), they become partly self-fulfilling — enough people act at those levels to make them matter. The sensible conclusion: treat an MA as one input among several, with confirmation, not a standalone trading system.
Famous moving-average strategies
These are the classic, widely-taught frameworks. Each is descriptive — a way to read structure, not a recommendation to act.
1. The moving-average crossover (two MAs). A faster MA and a slower MA. When the fast crosses above the slow, it's read as a bullish shift; when it crosses below, a bearish one. Simple, but prone to whipsaws in ranges.
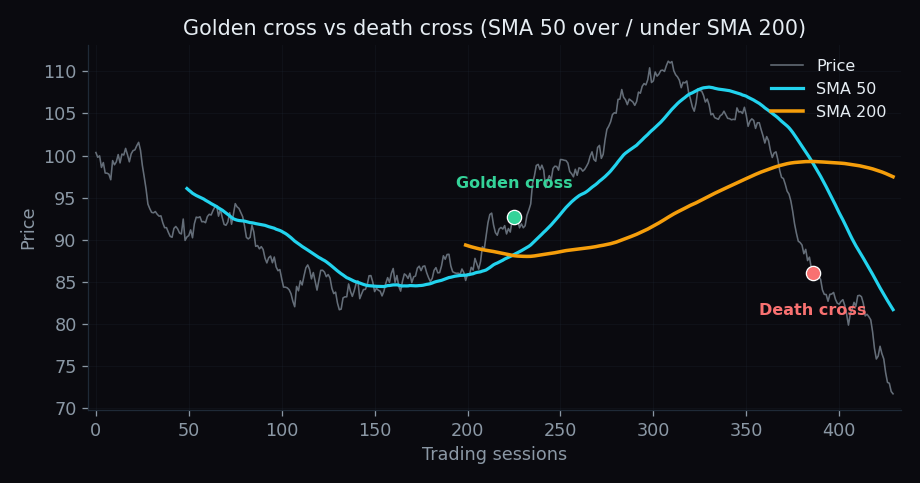
2. The golden cross and death cross. The most famous crossover, on the daily chart: the golden cross is the 50-day MA crossing above the 200-day (a long-term bullish signal); the death cross is the 50 crossing below the 200 (long-term bearish). They're slow and lag badly, but they capture major regime shifts — see the chart at the top of this article.
3. Price versus a single MA. Many trend followers keep it minimal: constructive while price is above the 200-day MA, defensive when it's below. The MA becomes a single bull/bear "line in the sand."
4. Pullback to a rising MA. In an established uptrend, traders wait for price to dip back to a rising MA (say the 20 or 50 EMA) and resume — using the average as dynamic support rather than chasing extended moves.
5. The moving-average ribbon. Stacking several MAs (for example 8 through 60, the Guppy/GMMA approach). When the ribbon fans out and aligns, the trend is strong; when the lines compress and tangle, momentum is fading.
6. Triple moving-average systems. Three MAs (fast, medium, slow) used together — the medium MA confirms the fast/slow relationship, cutting some false crossovers.
7. MA-based bands. Moving-average envelopes (a fixed % above/below an MA) and Bollinger Bands (a 20-period SMA midline with standard-deviation bands) use a moving average as the centre line to gauge how stretched price is from its mean.
Choosing the right periods
- Short-term (9, 20): responsive, for intraday and swing setups — more signals, more noise.
- Medium-term (50): the popular "trend" MA on daily charts.
- Long-term (100, 200): regime filters used by investors and institutions.
- Match the MA to your timeframe, and lean toward the widely-watched round numbers — precisely because everyone else watches them.
Common mistakes to avoid
- Using MA crossovers in a sideways market (whipsaw city).
- Piling on too many MAs until the chart is unreadable.
- Optimising periods to past data and assuming they'll repeat.
- Treating an MA as exact support — it's a zone, not a to-the-rupee level.
- Forgetting the lag: by the time a slow crossover triggers, a chunk of the move is already gone.
Tracking one moving average is easy; watching crossovers, ribbons and the 200-day line across Nifty, Bank Nifty and dozens of F&O stocks at once is not. That legwork is exactly what an analytics platform like TrueTrend handles for you — start free and keep your focus on the decision, not the arithmetic.
Key takeaways
- A moving average is the rolling average of price — it smooths noise to reveal trend.
- SMA is steady and slow; EMA is faster and noisier. Pick by timeframe.
- MAs show trend, dynamic support/resistance, and momentum at a glance.
- They lag and whipsaw in ranges — reliable in trends, weak in chop, never predictive on their own.
- The famous strategies (crossover, golden/death cross, price-vs-200-MA, pullback, ribbon) are all variations on one idea: follow the smoothed trend, and confirm before acting.
See these concepts on live market data — free
Create a free TrueTrend account to watch daily support/resistance levels, market regime, and option-positioning charts on NIFTY, BankNifty and 12 more instruments. Every level we publish is scored on a public scoreboard — misses included. No card required.
Free forever tier · daily levels with published hit-rates across every instrument. Descriptive market structure, not investment advice.
Not ready for an account? Get the daily levels by email.
One short email each market day — the indices' call wall, put wall, gamma flip and max pain, and how the last session's levels scored. Free, no account, unsubscribe anytime.
Descriptive market structure, not investment advice. We never share your email.