Open Interest Explained: Why It Matters in F&O Trading
If you trade Nifty or Bank Nifty options, you've seen the term everywhere — open interest, or OI. It sits right next to price on every option chain, yet most traders either ignore it or misread it. Used well, OI is one of the few numbers that hints at what the big money is actually doing.
Here's what open interest really is, why it matters far more than most people realise, and the honest reason it's so hard to use in real time.
What is open interest?
Open interest is the total number of option (or futures) contracts that are currently open — created but not yet closed or expired. Each contract has a buyer and a seller; OI counts that live commitment.
It's easy to confuse OI with volume, but they answer different questions:
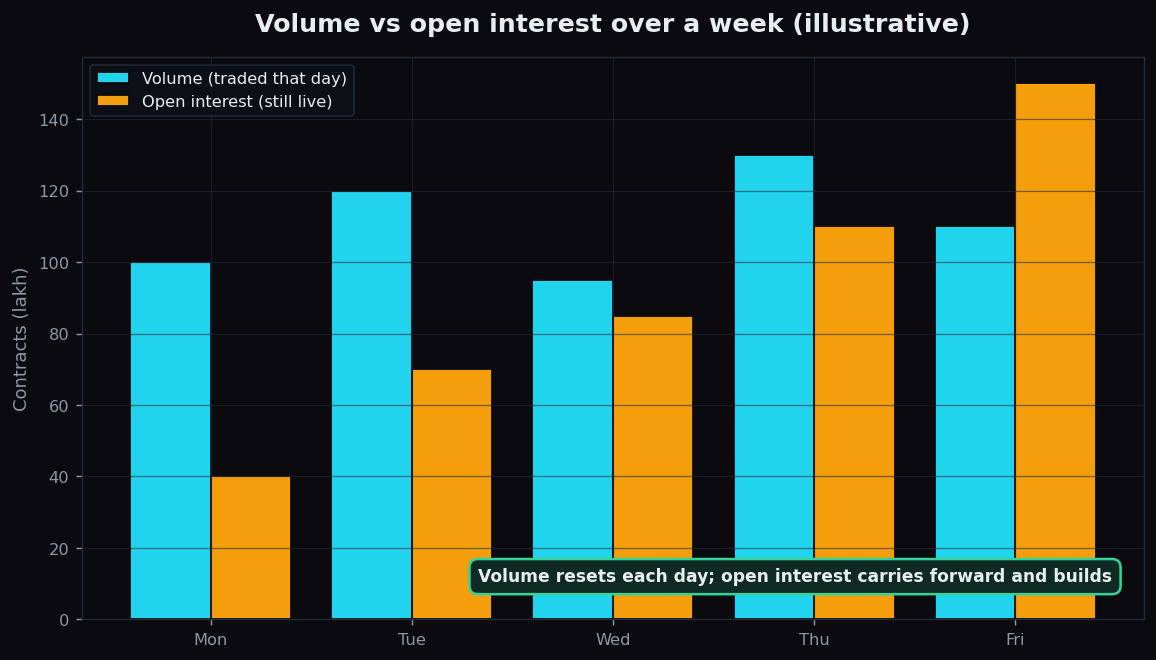
- Volume = how many contracts traded today (activity).
- Open interest = how many contracts are still live (commitment).
Volume resets every day. Open interest carries forward — it builds and unwinds as positions are added and closed. That persistence is exactly what makes it useful.
Why open interest matters
Price alone can mislead. The same green candle can mean fresh buyers piling in, or trapped sellers scrambling to exit — very different futures. Open interest helps tell them apart.
- It reveals conviction. When price moves and open interest rises in the same direction, new money is backing the move — a sign of strength. When price moves but OI falls, the move is often just position-closing, and tends to fade.
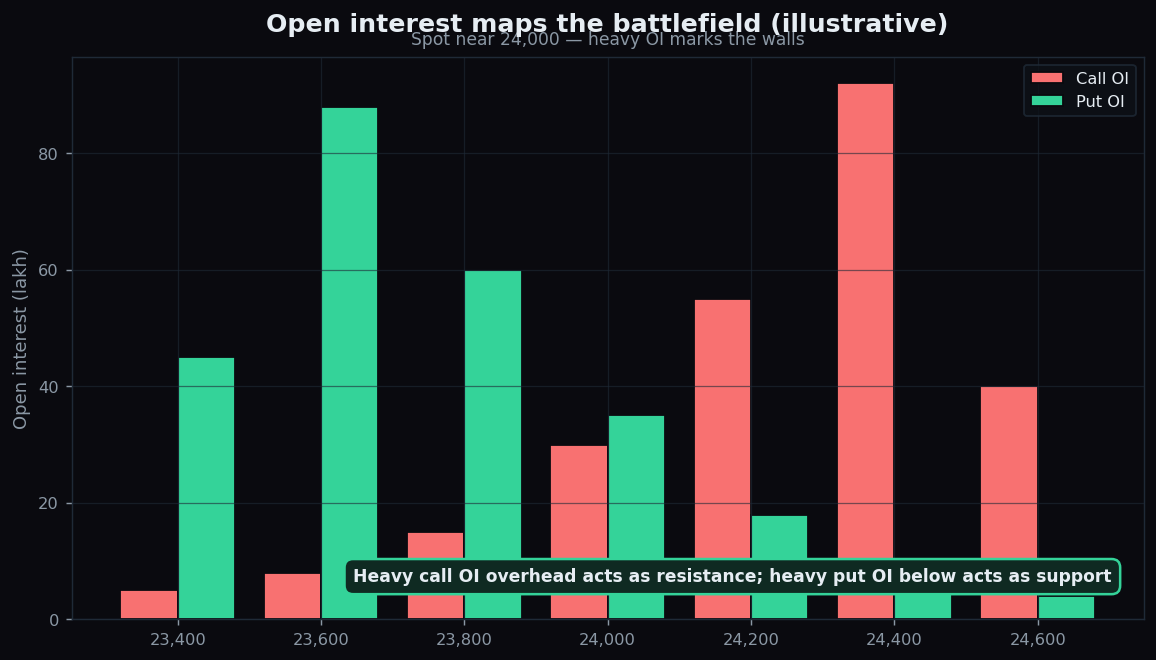
- It maps the battlefield. Strikes with the largest OI act like magnets and barriers. Heavy call OI above the price often behaves as resistance; heavy put OI below it, as support. These are the levels institutions are defending.
- It hints at positioning. Where OI is building — and on which side — is a window into how the larger players are positioned into expiry.
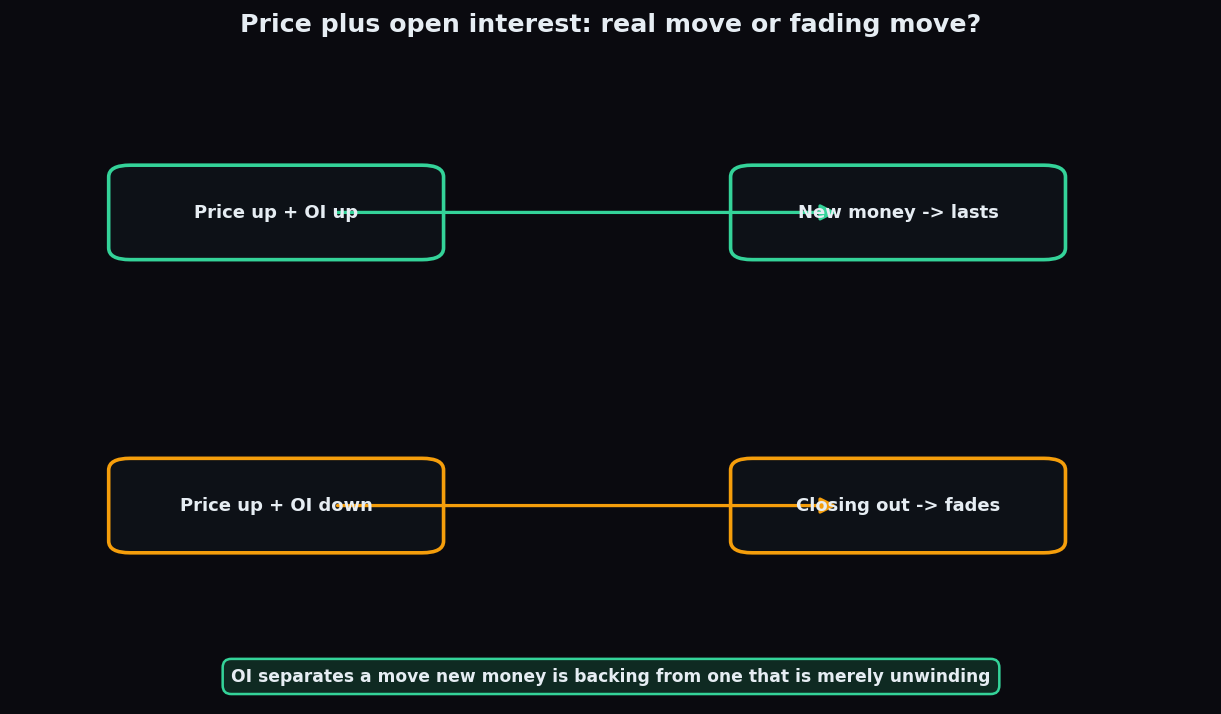
In short: price tells you what happened; open interest hints at who's behind it and whether it will last.
The catch: OI is brutal to track in real time
Here's the honest part. Open interest is powerful in theory and punishing in practice. A single index has dozens of strikes, each with its own call and put OI, all shifting minute by minute. Multiply that across Nifty, Bank Nifty, FinNifty, Sensex and the big F&O stocks, and the picture is enormous.
By the time a retail trader has pulled the option chain, eyeballed the numbers, and worked out where OI is building and which way it's shifting, the move has usually already happened. The raw exchange chain gives you a static snapshot — not the live flow, and not the context of how today compares to the sessions before it.
Turning open interest into an at-a-glance edge
This is the gap TrueTrend was built to close. Instead of squinting at a wall of strike-by-strike numbers, you get the open-interest picture read for you, live — across Nifty, Bank Nifty and the major F&O names, in one clean view, without the spreadsheet gymnastics.
The point isn't more data. It's the opposite: the kind of institutional-grade OI insight that desks pay heavily for, distilled into something you can glance at and act on in the moment — so you're reading the move as it builds, not after it's gone.
If open interest has ever felt like a number you should be using but never quite could — that's exactly the problem TrueTrend solves. Create a free account and see the live picture for yourself.
Key takeaways
- Open interest = live commitment (open contracts), not daily activity (that's volume).
- Price plus OI separates real moves from fading ones and reveals key support and resistance.
- It's genuinely hard to track manually — the edge is in seeing it live and in context.
- That's the work TrueTrend does for you. Start free, and watch our public Scoreboard to see how seriously we take measured, honest analysis.
See these concepts on live market data — free
Create a free TrueTrend account to watch daily support/resistance levels, market regime, and option-positioning charts on NIFTY, BankNifty and 12 more instruments. Every level we publish is scored on a public scoreboard — misses included. No card required.
Free forever tier · daily levels with published hit-rates across every instrument. Descriptive market structure, not investment advice.
Not ready for an account? Get the daily levels by email.
One short email each market day — the indices' call wall, put wall, gamma flip and max pain, and how the last session's levels scored. Free, no account, unsubscribe anytime.
Descriptive market structure, not investment advice. We never share your email.