Open Interest (OI): How to Read It in Nifty and Bank Nifty
Open interest (OI) is the count of option contracts that are still open — live positions nobody has closed yet. It is the single most-quoted number on the Nifty and Bank Nifty option chain, and also the most misread. This post explains what OI really measures, how it differs from volume, and how to read the OI “walls” that traders watch — checked against our own track record.
What open interest actually measures
Open interest is the total number of contracts currently outstanding at a strike. A contract is created when a buyer and a seller open a new position; it disappears from OI only when that position is closed. So OI rises when fresh money opens trades and falls when existing trades are squared off.
This is what separates it from volume. Volume counts every contract traded during the day, including the same lot changing hands many times. Open interest counts only what is still standing at the end. If 50,000 Nifty 24,000-call contracts trade today but most are intraday round-trips, volume looks large while OI barely moves — a sign the activity was churn, not commitment.
Read the change, not just the level
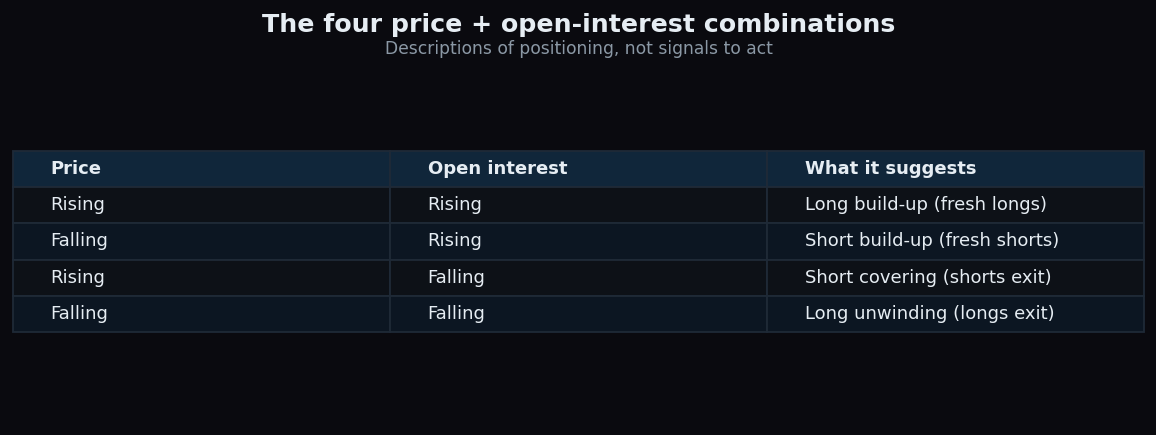
A big OI number at a strike tells you positions are concentrated there. The direction of the change, read alongside price, is what hints at who is committing. The four standard combinations are:
- Rising price + rising OI — fresh longs are being added (long build-up).
- Falling price + rising OI — fresh shorts are being added (short build-up).
- Rising price + falling OI — shorts are closing out (short covering).
- Falling price + falling OI — longs are closing out (long unwinding).
These are descriptions of positioning, not signals to act. The same OI shift can precede very different outcomes, and on index options the writer on the other side may simply be hedging elsewhere. Treat the grid as context for what the crowd is doing, then form your own view.
Reading OI on the Nifty and Bank Nifty option chain
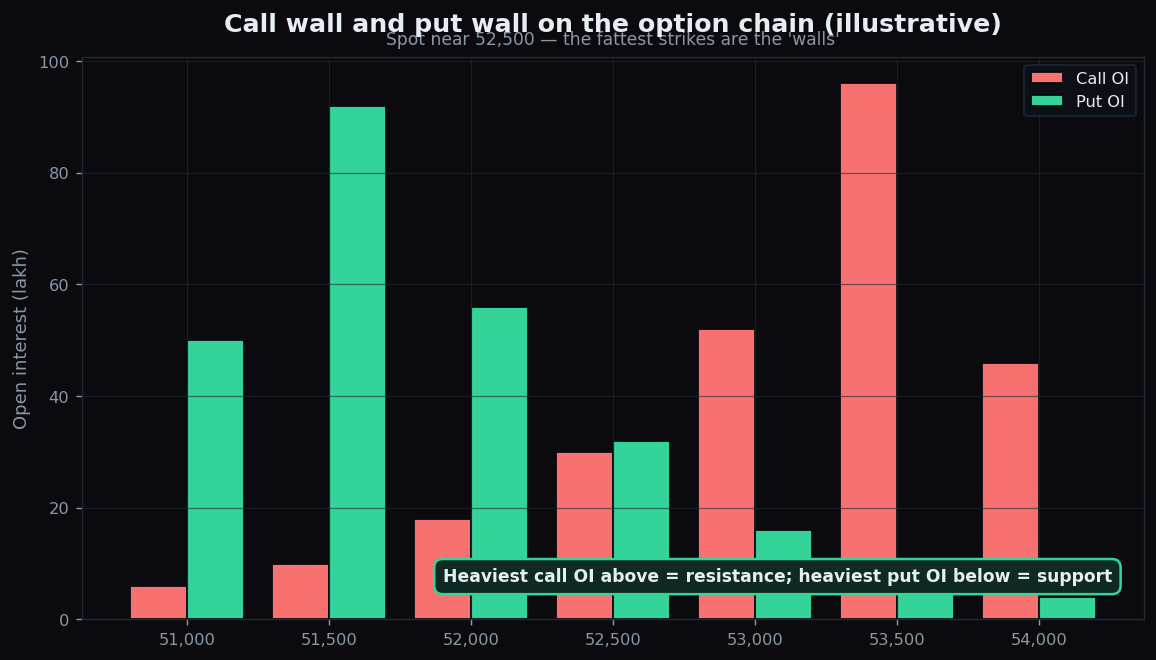
On the chain, the strikes with the largest open interest are the ones traders nickname:
- Call wall — the strike above spot carrying the heaviest call OI. Heavy call writing there can act as resistance.
- Put wall — the strike below spot carrying the heaviest put OI. Heavy put writing there can act as support.
- Max pain — the strike where, by OI weighting, the largest number of option buyers would expire out of the money. Price is said to gravitate here near expiry.
Bank Nifty’s OI tends to sit in fewer, fatter strikes than Nifty’s, so its walls look sharper — but, as the data below shows, sharper-looking is not the same as more reliable.
What our own data says about OI walls
We compute these OI levels from the morning option-chain snapshot and then score, every session, whether price actually respected them — keeping the misses in. Across more than 600 scored instrument-sessions over the 14 instruments we track, here is how the Nifty and Bank Nifty OI walls held up:
Nifty 50
- Put wall held when touched: 69% (n=16)
- Call wall held when touched: 69% (n=13)
- Closed within one strike of max pain: 39% (n=51)
Bank Nifty
- Put wall held when touched: 67% (n=9)
- Call wall held when touched: 29% (n=7)
- Closed within one strike of max pain: 8% (n=50)
Two things stand out. First, Nifty’s put and call walls held roughly seven times in ten when price actually reached them — genuinely useful context, though the samples are small because touches are rare. Second, max pain is far weaker than its reputation: an 8% pin rate on Bank Nifty is worse than a coin flip, so treating max pain as a precise expiry magnet is not supported by our data for these instruments.
OI walls are context, not certainties. A Bank Nifty call wall that held only about 3 in 10 times it was touched (n=7) is a small, noisy sample — read every wall with its sample size attached, and decide for yourself. We publish the weak numbers on purpose.
The full, continuously updated table — hits and misses, with sample sizes — is free and login-free on our public Scoreboard. For the deeper write-up of how often these walls actually hold, see do option walls actually hold in Nifty and Bank Nifty.
What OI does not tell you
Open interest is a snapshot of positioning, not a forecast. It cannot tell you why a position was opened — directional view, hedge, or arbitrage leg all look identical in the OI column. It says nothing about the price someone paid, and big OI can unwind in minutes on a news shock. And because every contract has a buyer and a seller, OI never tells you which side is right. Used as one layer of context alongside price and your own plan, it is informative. Used as a prediction, it disappoints.
TrueTrend turns market structure like this into a clear, at-a-glance read across Nifty, Bank Nifty and the major F&O names — create a free account and see it live.
See these concepts on live market data — free
Create a free TrueTrend account to watch daily support/resistance levels, market regime, and option-positioning charts on NIFTY, BankNifty and 12 more instruments. Every level we publish is scored on a public scoreboard — misses included. No card required.
Free forever tier · daily levels with published hit-rates across every instrument. Descriptive market structure, not investment advice.
Not ready for an account? Get the daily levels by email.
One short email each market day — the indices' call wall, put wall, gamma flip and max pain, and how the last session's levels scored. Free, no account, unsubscribe anytime.
Descriptive market structure, not investment advice. We never share your email.