The Price-to-Book (P/B) Ratio Explained for Beginners
Every listed company has two prices hiding inside it. One is what the stock market thinks it is worth right now — the share price. The other is what its own accounts say it is worth on paper — the book value. The Price-to-Book ratio, or P/B, simply puts one over the other. It is one of the oldest, simplest yardsticks in fundamental analysis, and it answers a single blunt question: how much are you paying for each rupee of the company's recorded net worth?
What the P/B ratio actually is
Let us define the two ingredients first.
- Book value is what is left for shareholders if a company sold every asset at the value on its books and paid off every debt. In accounting terms it is total assets minus total liabilities — also called shareholders' equity or net worth.
- Book value per share takes that figure and divides it by the number of shares outstanding, so you get the paper net worth behind a single share.
The P/B ratio is then just:
P/B = market price per share ÷ book value per share
A simple analogy: imagine a second-hand furniture shop. The book value is the price tag the owner wrote based on what the furniture originally cost, minus wear and tear. The market price is what a buyer is actually willing to pay today. P/B is the gap between the sticker the owner wrote and the offer on the table. Sometimes buyers pay more than the sticker because the brand is trusted; sometimes they pay less because nobody wants old wardrobes.
A worked example with round numbers
Take a fictional firm, NovaTextiles. Its balance sheet shows total assets of ₹500 crore and total liabilities of ₹300 crore. So its book value is ₹500 − ₹300 = ₹200 crore. Say it has 1 crore shares. That means book value per share is ₹200.
Now the stock trades at ₹300 per share. The P/B is ₹300 ÷ ₹200 = 1.5. In plain English, the market is paying ₹1.50 for every ₹1 of recorded net worth.
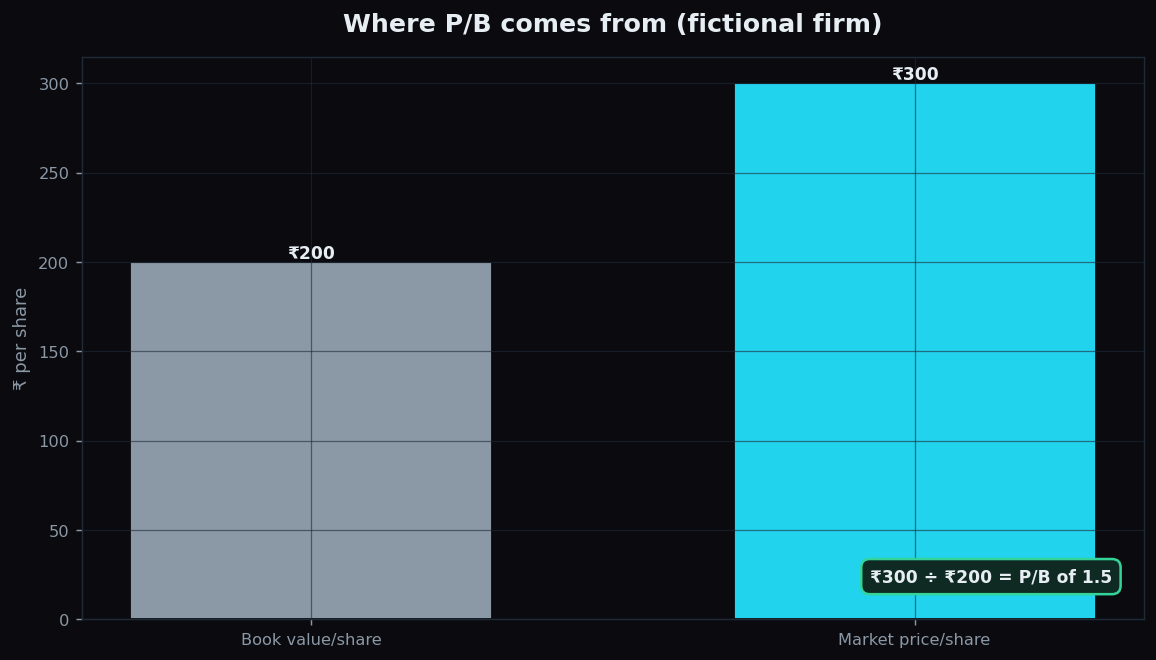
If the same share instead traded at ₹180, the P/B would be 0.9 — below 1, meaning the market price sits under the paper net worth. If it traded at ₹1,400, the P/B would be 7.0, a sign the market is pricing in far more than the books contain.
Why P/B matters
P/B earns its keep because it leans on the balance sheet — the snapshot of what a company owns and owes — rather than on profit, which can swing wildly from year to year. That makes it especially useful in three situations.
- Asset-heavy businesses. Banks, insurers, shipping firms and metals companies carry large, measurable assets. For them, book value is meaningful, so P/B is a natural fit.
- Loss-making years. When a company has no profit, the popular Price-to-Earnings ratio breaks down — you cannot divide by zero or by a loss in any useful way. P/B still works because equity is usually positive even when profits are not.
- A rough floor. A P/B near or below 1 is often read as the market valuing the business at little more than its liquidation worth, which some long-term investors use as a starting point for further digging.
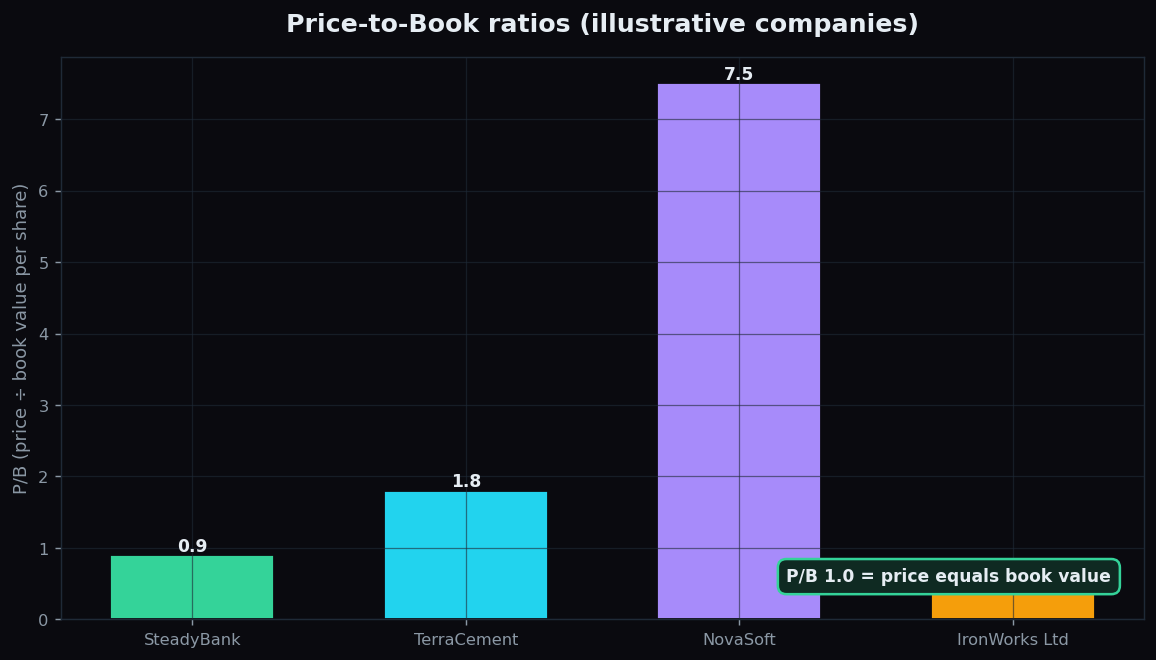
The chart below shows how widely P/B can vary across four made-up companies. Notice that the software firm carries a far higher multiple than the bank or the cement maker — that is the market paying up for expected growth and assets that do not show up on a balance sheet, like code and brand.
How investors read it
There is no universally correct P/B. Instead, analysts read it as a relative clue, compared against the company's own history and against peers in the same industry. Here is how the bands are commonly interpreted — remembering that each reading is a question, not an answer.
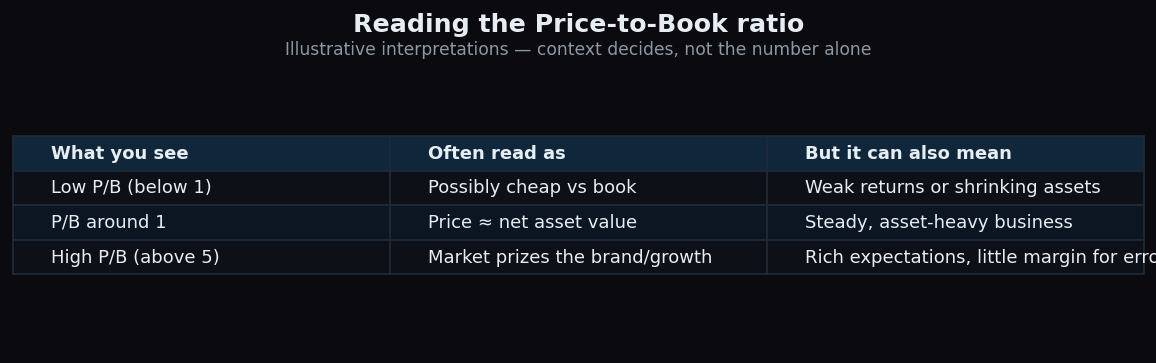
A low P/B is often read as a possible bargain, but it can equally signal a business whose assets are earning poor returns or are quietly losing value. A high P/B is often read as the market rewarding a strong brand, high returns on equity, or fast growth — but it also means expectations are baked in, leaving less room for disappointment. The number frames the conversation; the explanation lives in the business.
The honest catch
P/B has real blind spots, and ignoring them is how people get burned.
- Book value is an accounting figure, not a market truth. Assets are often recorded at historical cost, so a factory bought decades ago may be worth far more — or far less — than its book entry.
- It misses intangibles. A software or consumer-brand company's real value lives in code, patents, and customer loyalty, none of which sit fully on the balance sheet. That is exactly why such firms routinely trade at high P/B and why the ratio is a weak tool for them.
- Buybacks and write-downs distort it. Share buybacks can shrink book value and mechanically lift P/B; a one-time write-down can do the opposite. The ratio moves even when the underlying business has not.
- A cheap ratio can be a value trap. A stubbornly low P/B sometimes reflects a business in slow decline that deserves to trade below book.
This is why P/B is best used alongside other measures — return on equity, debt levels, and earnings trends — rather than alone. A low P/B paired with healthy returns tells a very different story from a low P/B paired with falling profits.
Ratios like P/B describe structure, not destiny. TrueTrend is built to help curious beginners read that structure with clear, jargon-free context — you can start free and learn the language of the market at your own pace.
Key takeaways
- P/B = market price per share ÷ book value per share. It shows how much you pay for each rupee of recorded net worth.
- Book value is total assets minus total liabilities — the paper worth left for shareholders.
- A P/B near 1 means price roughly equals book value; below 1 is often read as cheap, above 5 as rich with expectations.
- It shines for asset-heavy or loss-making businesses where Price-to-Earnings struggles.
- It is weak for intangible-heavy firms and can be distorted by old asset values, buybacks, and write-downs.
- Treat P/B as one clue among several, never a standalone verdict — pair it with returns and debt before drawing conclusions.
See these concepts on live market data — free
Create a free TrueTrend account to watch daily support/resistance levels, market regime, and option-positioning charts on NIFTY, BankNifty and 12 more instruments. Every level we publish is scored on a public scoreboard — misses included. No card required.
Free forever tier · daily levels with published hit-rates across every instrument. Descriptive market structure, not investment advice.
Not ready for an account? Get the daily levels by email.
One short email each market day — the indices' call wall, put wall, gamma flip and max pain, and how the last session's levels scored. Free, no account, unsubscribe anytime.
Descriptive market structure, not investment advice. We never share your email.