The P/E Ratio Explained Simply for Beginners
The price-to-earnings ratio, or P/E, is the single most quoted number in stock investing — and one of the most misread. At its heart it answers a simple question: how much are you paying for every rupee of a company's yearly profit? Get comfortable with that one idea and a lot of market chatter suddenly makes sense.
What the P/E ratio actually is
The P/E ratio is a fraction. On top is the share price — what one share costs today. On the bottom is earnings per share (EPS) — the company's yearly net profit divided by the number of shares. Put them together and you get:
P/E = share price ÷ earnings per share.
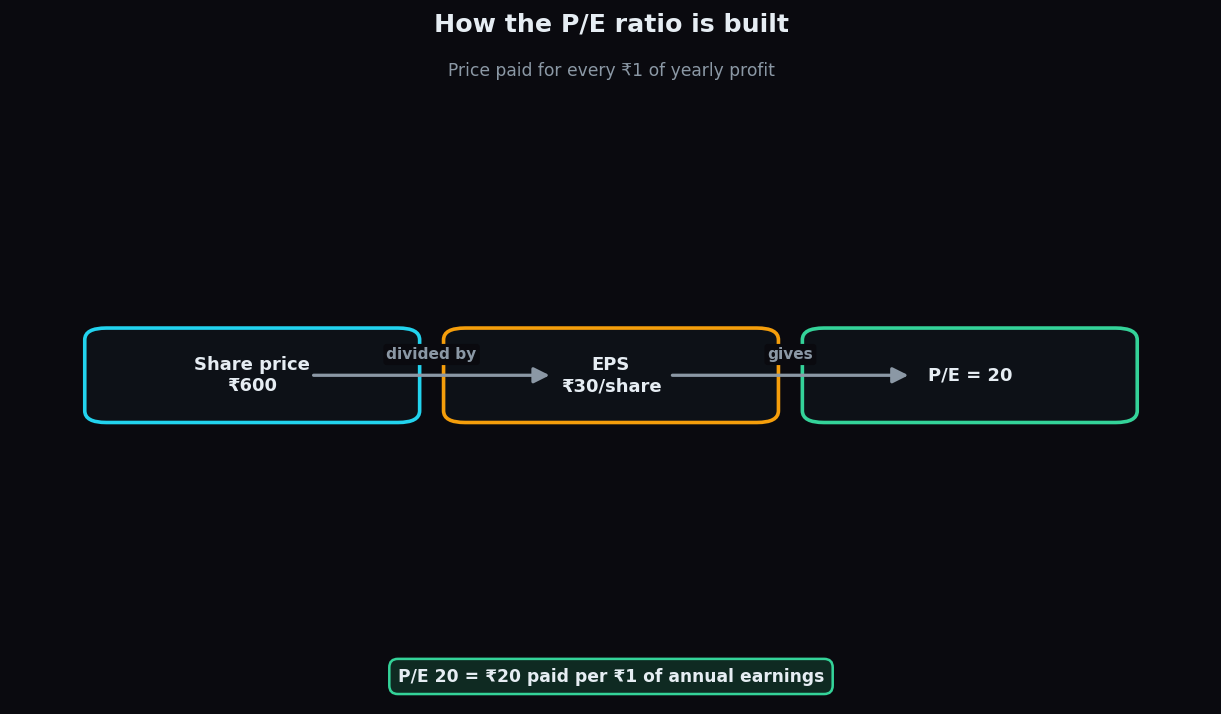
Imagine a fictional company, Sunrise Foods. Its shares trade at ₹600. Over the past year it earned ₹30 of profit per share. So its P/E is 600 ÷ 30 = 20. In plain words: you are paying ₹20 today for each ₹1 of profit the company made last year. That is all a P/E of 20 means.
An everyday analogy
Think of buying a small tea stall. If the stall earns ₹1,00,000 profit a year and the owner asks for ₹20,00,000, you are paying 20 times one year's profit — a P/E of 20. If a second, busier stall earning the same ₹1,00,000 is priced at ₹40,00,000, its "P/E" is 40. You would naturally ask: why is the second one twice as expensive for the same current profit? That question is exactly what the P/E invites you to ask about a stock.
Why the P/E ratio matters
The P/E is a quick yardstick for how expensive a stock is relative to what it earns. A raw price tells you almost nothing on its own. A ₹600 share is not "expensive" and a ₹50 share is not "cheap" until you know how much profit sits behind each. The P/E puts every company on the same scale so you can compare a ₹600 stock with a ₹50 one fairly.
It also captures, in one number, what the market expects. A high P/E usually means investors are willing to pay a lot now because they expect profits to grow strongly later. A low P/E often means the market expects little growth — or is worried about something.
High P/E vs low P/E — and why context rules
Here is where beginners go wrong: they assume low P/E is always "good value" and high P/E is always "overpriced." Reality is messier. The same number can tell opposite stories.
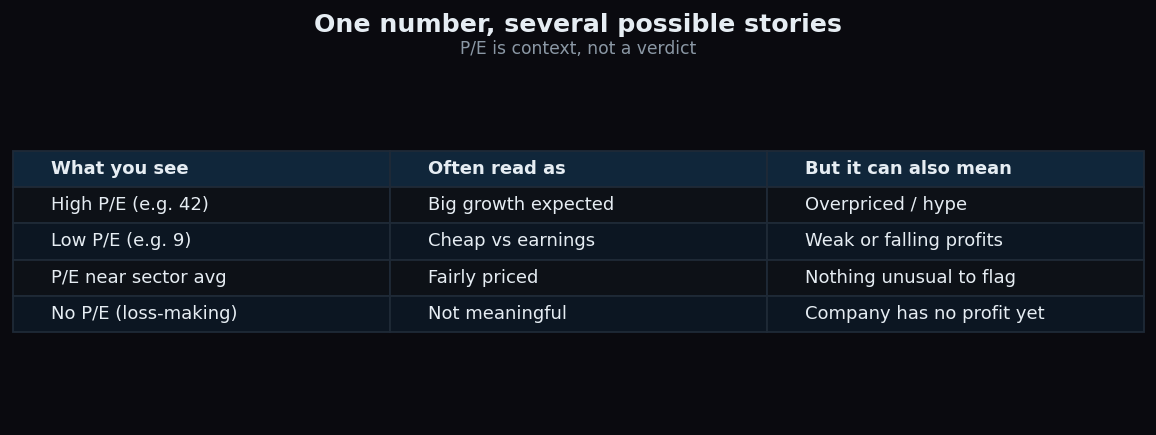
A high P/E of 42 is often read as strong growth ahead — but it can also mean a stock is priced on hype and has far to fall if growth disappoints. A low P/E of 9 is often read as a bargain — but it can equally signal a business whose profits are shrinking, so the "cheap" price is cheap for a reason. The P/E raises the question; it does not answer it.
Sector context is everything
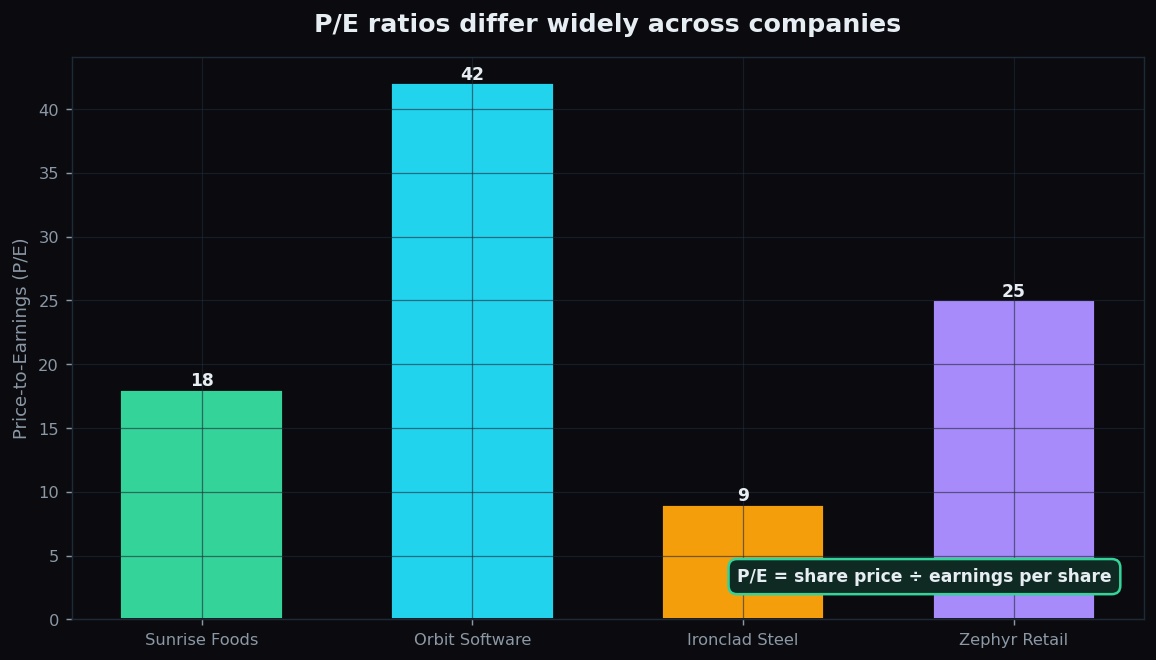
P/E ranges differ hugely by industry. Look at four fictional firms. Orbit Software trades at a P/E of 42, Zephyr Retail at 25, Sunrise Foods at 18, and Ironclad Steel at just 9. That does not automatically make the steel maker the best buy. Fast-growing software companies typically carry high P/Es because investors expect years of rising profit. Heavy, cyclical businesses like steel usually carry low P/Es because their earnings swing up and down with the economy.
The useful comparison is a company against its own history and its own sector peers — not against a company from a completely different industry. A P/E of 25 might be high for a steel maker and low for a hot software firm.
How the P/E is used in practice
People generally use the P/E in three ways, all of them comparative:
- Versus the sector. Is this company's P/E above or below the typical range for its industry? A gap is a prompt to dig into why.
- Versus its own past. Is the stock trading at a higher multiple than it usually does? That can hint at rising optimism — or stretched expectations.
- Versus its growth rate. A P/E of 30 looks different for a company growing profits 30% a year than for one growing 5%. Some investors compare the two directly.
Notice the theme: the P/E is never a verdict by itself. It is the start of a conversation, a flag that says "look closer here."
The honest catch
The P/E has real blind spots, and it is only fair to name them:
- No earnings, no P/E. A loss-making company has no meaningful P/E at all — the maths breaks. Many young, fast-growing firms fall in this bucket.
- Earnings can be flattered. Profit is an accounting figure. One-off gains, asset sales, or aggressive accounting can inflate EPS for a year and make the P/E look deceptively low.
- It looks backward. The common "trailing" P/E uses last year's profit. Markets price the future, so a cheap-looking trailing P/E can hide the fact that profits are about to fall.
- It ignores debt. Two firms with the same P/E can carry wildly different debt loads and risk. Price and earnings alone miss that.
None of this makes the P/E useless. It makes it a starting point — one gauge on a dashboard, to be read alongside growth, debt, cash flow, and the quality of those earnings.
Want to build an investing vocabulary one clear idea at a time? TrueTrend's education library and market tools translate jargon into plain language so you can read the market for yourself. Create a free account to start learning.
Key takeaways
- P/E = share price ÷ earnings per share — it is the price you pay for ₹1 of yearly profit.
- A P/E of 20 means ₹20 paid today for each ₹1 the company earned last year.
- High P/E is often read as high growth expectations; low P/E as cheapness or trouble — but each can mean the opposite.
- Only compare P/Es within the same sector and against the company's own history; ranges differ by industry.
- The P/E ignores debt, can be flattered by one-off earnings, looks backward, and does not exist for loss-making firms.
- Treat it as a question to investigate, never a buy-or-sell verdict on its own.
See these concepts on live market data — free
Create a free TrueTrend account to watch daily support/resistance levels, market regime, and option-positioning charts on NIFTY, BankNifty and 12 more instruments. Every level we publish is scored on a public scoreboard — misses included. No card required.
Free forever tier · daily levels with published hit-rates across every instrument. Descriptive market structure, not investment advice.
Not ready for an account? Get the daily levels by email.
One short email each market day — the indices' call wall, put wall, gamma flip and max pain, and how the last session's levels scored. Free, no account, unsubscribe anytime.
Descriptive market structure, not investment advice. We never share your email.