Put-Call Ratio (PCR) Explained: Sentiment and Its Limits
The put-call ratio, or PCR, is one of the first sentiment gauges a new options trader meets. It squeezes a whole option chain into a single number. That makes it handy — and also easy to over-trust. This guide explains exactly what PCR measures, how the famous contrarian reading works, and why seasoned watchers treat it with a heavy dose of caution.
What the put-call ratio measures
A put is a contract giving the right to sell an underlying at a fixed price; a call is the right to buy at a fixed price. The put-call ratio compares how much put activity there is against call activity. The most common version uses open interest — the number of contracts still open:
PCR = total put open interest ÷ total call open interest.
If puts and calls have equal open interest, PCR is 1.0. More open puts than calls pushes PCR above 1.0; more open calls pushes it below 1.0. (Some versions use traded volume instead of open interest; the idea is the same, the number just moves faster.)
A worked example
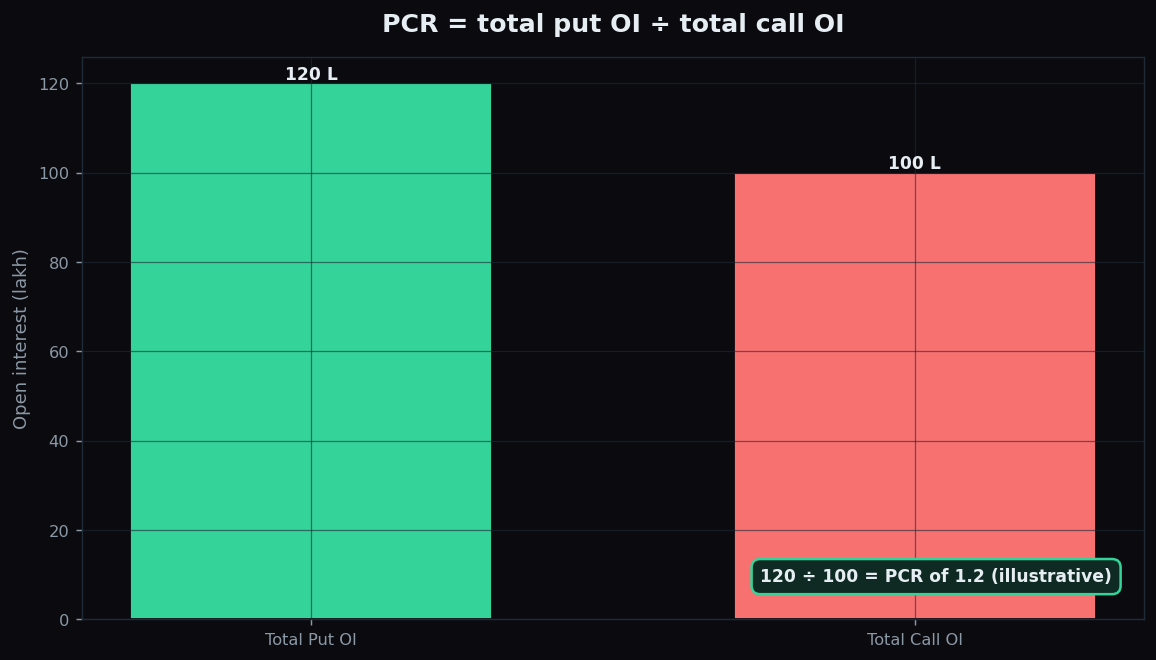
Suppose you add up every strike on a synthetic chain and find 120 lakh of open put contracts and 100 lakh of open call contracts. Then:
PCR = 120 ÷ 100 = 1.2.
A PCR of 1.2 simply says there is 20% more open put interest than call interest at that moment. That is the entire calculation. No forecast is baked in — it is one snapshot of how open positions are split between puts and calls.
The contrarian reading
Here is where PCR gets its reputation. Many market watchers read it as a contrarian gauge — a mood ring that is most interesting at extremes. The logic runs like this:
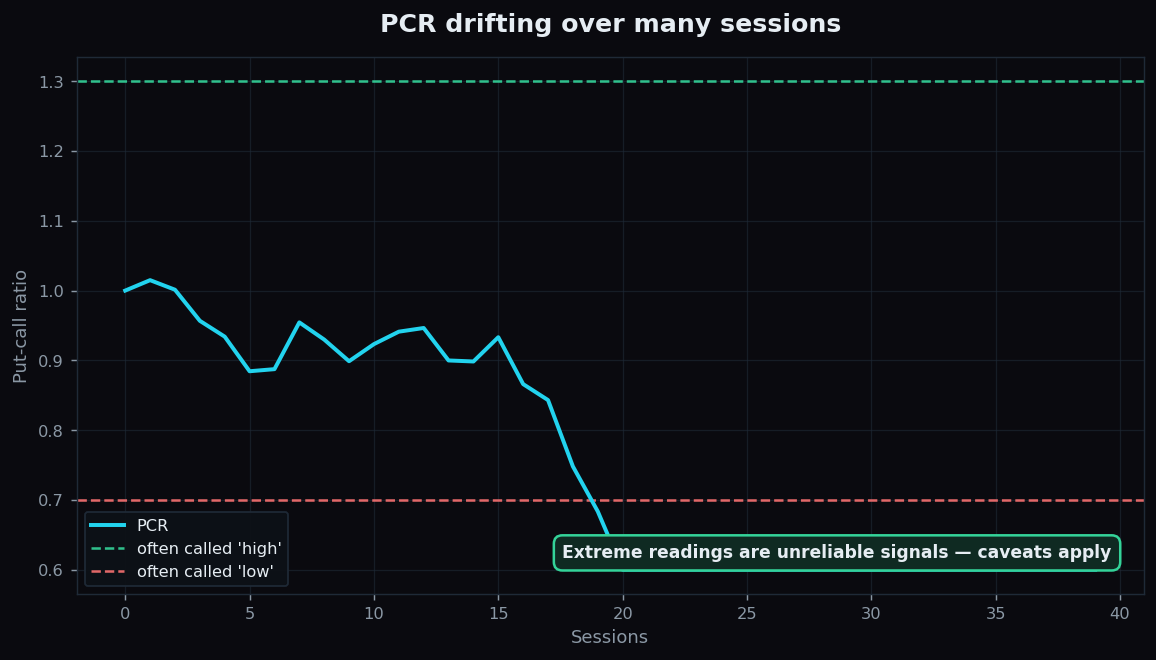
- A very high PCR (say well above 1.3) means unusually heavy put positioning. Contrarians describe this as the crowd leaning fearful, and note that crowds are often most fearful near the end of a fall rather than the start.
- A very low PCR (say well below 0.7) means unusually heavy call positioning. Contrarians describe this as the crowd leaning greedy, which they associate with over-optimism.
The everyday analogy is a party. When absolutely everyone insists the night can only get better, the fun may already be peaking. When everyone has written it off as a dud, the mood has little further to fall. PCR is one attempt to put a number on that crowd mood.
Why the caveats are the important part
PCR is genuinely useful for describing sentiment, but the contrarian reading is unreliable, and honest analysts say so plainly:
- Correlation is not causation. A high PCR and a later bounce sometimes appear together, but the ratio does not cause the move, and the pairing breaks down often. In a strong downtrend, PCR can stay elevated for weeks while price keeps sliding.
- There is no magic threshold. The 0.7 and 1.3 lines are rough conventions, not laws. What counts as extreme differs across indices, single stocks, and expiries, and it drifts over time.
- Hedging pollutes the signal. Many puts are bought as insurance by holders who are not bearish at all. That mechanical hedging can lift PCR without any change in genuine sentiment.
- It is a snapshot, and a lagging one. Open interest updates with a delay, so PCR describes positions already taken, never the next move.
Because of all this, PCR is best treated as one descriptive input among many — a thermometer for crowd positioning, not a timing tool. Anyone who tells you a single PCR number is a reliable signal to act is overselling it.
TrueTrend shows sentiment context like PCR alongside its caveats, so beginners see the full picture instead of one lonely number. Create a free account to explore it.
Key takeaways
- PCR = total put OI ÷ total call OI. Above 1.0 means more open puts; below 1.0 means more open calls.
- In the worked example, 120 lakh puts and 100 lakh calls give a PCR of 1.2.
- The contrarian reading treats very high PCR as crowd fear and very low PCR as crowd greed — like reading the mood at a party.
- Those extreme readings are unreliable: correlation is not causation, thresholds are not fixed, and hedging distorts the ratio.
- Use PCR as one descriptive, lagging sentiment gauge — never as a standalone instruction.
See these concepts on live market data — free
Create a free TrueTrend account to watch daily support/resistance levels, market regime, and option-positioning charts on NIFTY, BankNifty and 12 more instruments. Every level we publish is scored on a public scoreboard — misses included. No card required.
Free forever tier · daily levels with published hit-rates across every instrument. Descriptive market structure, not investment advice.
Not ready for an account? Get the daily levels by email.
One short email each market day — the indices' call wall, put wall, gamma flip and max pain, and how the last session's levels scored. Free, no account, unsubscribe anytime.
Descriptive market structure, not investment advice. We never share your email.