Relative Strength: A Stock vs the Index Explained
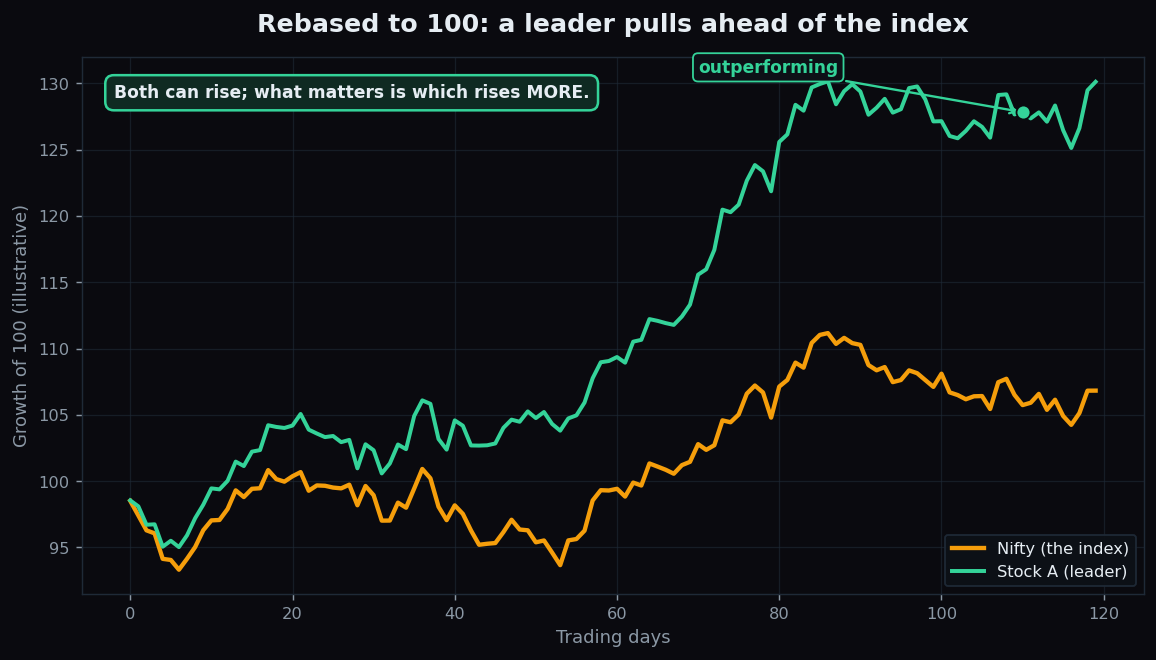
A stock can rise 10% and still be a laggard. It can fall 5% and still be a leader. It sounds backwards until you add the missing word: compared to what? Relative strength answers that question by measuring a stock against the broader market instead of against zero. It is one of the most useful ideas a beginner can learn — and one of the most commonly confused, because it shares part of its name with a totally different tool.
First, clear up the name
This post is about relative strength (RS) — a stock measured relative to an index. It is not the RSI (Relative Strength Index), a popular oscillator that measures a single stock against its own recent history and bounces between 0 and 100. The names overlap, the ideas do not. RS compares two things (a stock and the market); RSI looks at one thing (a stock versus itself). Keep them in separate boxes in your head.
What relative strength is
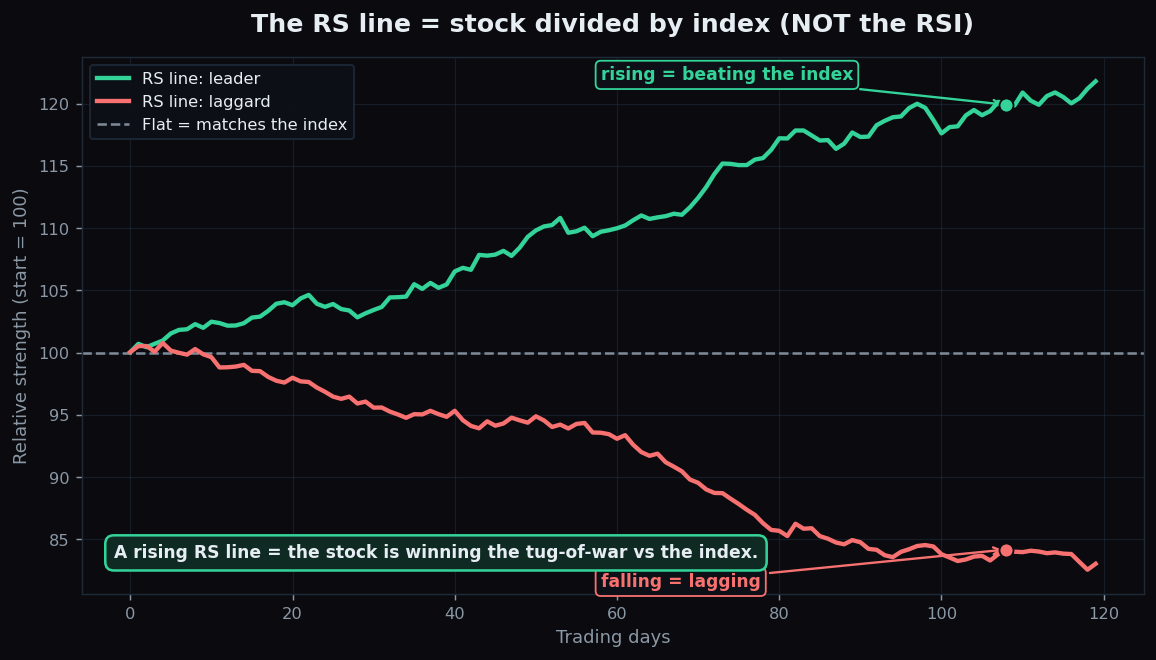
Relative strength is simply a stock’s performance divided by a benchmark’s performance — usually a broad index like the Nifty 50. You plot it as the RS line:
RS line = stock price ÷ index level
The actual number does not matter; its direction is everything. To read it cleanly, you rebase both to 100 at a starting date. After that:
- An RS line that rises means the stock is outperforming the index — it is winning the race, regardless of whether the market is up or down.
- An RS line that falls means the stock is underperforming — it is losing the race.
- A flat RS line means the stock is simply matching the index, moving in lockstep.
Notice that the RS line can climb even while the stock falls, as long as the stock falls less than the index. That is the whole point: it strips out the market’s tide and shows you the swimmer’s own strength.
Why it matters: leaders versus laggards
On any given day, most stocks drift in the same broad direction as the market — the tide lifts or drops nearly all the boats. Looking at a stock’s raw price alone, you cannot tell how much of its move was the stock and how much was just the tide. Relative strength separates the two.
The everyday analogy is a group bike ride into a headwind. Everyone slows down, so judging riders by raw speed is unfair — the wind is hitting them all. But the rider who falls back the least is clearly the strongest in the group. Relative strength is that ranking. It finds the riders pulling ahead of the pack (leaders) and the ones quietly slipping back (laggards), even when the whole pack is moving together.
This is why analysts watch the RS line for clues about where genuine demand is concentrated. A stock whose RS line has been steadily climbing is being bought more eagerly than the average stock — that persistence is the information, not any single day’s move.
A worked example with round numbers
Compare two stocks over the same stretch, with the index as the yardstick. Start everything at 100.
- The index rises from 100 to 110 — a 10% gain for the market overall.
- Stock A rises from 100 to 125 — a 25% gain.
- Stock B rises from 100 to 104 — a 4% gain.
Both stocks went up, so a beginner looking only at raw prices might call both winners. Relative strength tells a sharper story:
- Stock A’s RS line = 125 ÷ 110 = 1.14 → rebased, it climbed from 100 to about 114. A clear leader.
- Stock B’s RS line = 104 ÷ 110 = 0.95 → rebased, it slipped from 100 to about 95. A laggard, despite being up 4%.
Stock B made money and fell behind the market at the same time. Without the benchmark you would never have seen it. That gap — up in price, down in relative strength — is exactly the insight RS exists to surface.
How it is used
Relative strength is usually treated as a filter and a context layer, not a stand-alone trigger:
- Spotting leadership. Sorting a list of stocks by their RS line highlights which names are being accumulated faster than the crowd.
- Comparing within a basket. The same trick ranks sectors against the index, or stocks against their own sector, to see where strength is rotating.
- Sanity-checking a move. If a stock pops 3% but the index popped 4%, the RS line actually ticked down — the pop was just the tide. RS keeps you honest about that.
The honest catch
Relative strength is descriptive, and it has real blind spots:
- It says nothing about absolute returns. A stock can have a beautifully rising RS line while still losing money — it just lost less than the index. “Strongest faller” is still a faller.
- The benchmark choice changes the answer. Measured against a broad index a stock may look strong; against its own hot sector it may look weak. Always know what yardstick you are using.
- It is backward-looking. The RS line is built from prices that have already happened. Past leadership does not guarantee future leadership; leaders become laggards and vice versa.
- Leadership can flip fast. A long-rising RS line can roll over quickly when sentiment shifts, so a single snapshot can mislead.
Used as a way to see past the market’s tide and judge a stock on its own merit, relative strength is a quietly powerful lens. Used as a promise about tomorrow, it is just another backward-looking line.
Seeing which names are genuinely leading the market — rather than just floating on the tide — is easier with the context laid out plainly. TrueTrend frames market structure in beginner-friendly language so leaders and laggards stand out — create a free account to explore.
Key takeaways
- Relative strength (RS) compares a stock to an index; it is not the RSI, which compares a stock to its own history.
- The RS line = stock ÷ index; rising means outperforming, falling means lagging, flat means matching — direction is what matters.
- RS strips out the market’s tide to reveal genuine leaders and laggards, even when everything moves together.
- A stock can rise in price yet fall in relative strength if it gains less than the index — that hidden gap is the whole point.
- RS says nothing about absolute profit, depends on the benchmark you pick, and looks backward — treat it as context, not a forecast.
See these concepts on live market data — free
Create a free TrueTrend account to watch daily support/resistance levels, market regime, and option-positioning charts on NIFTY, BankNifty and 12 more instruments. Every level we publish is scored on a public scoreboard — misses included. No card required.
Free forever tier · daily levels with published hit-rates across every instrument. Descriptive market structure, not investment advice.
Not ready for an account? Get the daily levels by email.
One short email each market day — the indices' call wall, put wall, gamma flip and max pain, and how the last session's levels scored. Free, no account, unsubscribe anytime.
Descriptive market structure, not investment advice. We never share your email.