ROE and ROCE Explained: Reading Business Quality
If you handed two managers the same pile of money and came back a year later, the one who turned it into more profit is clearly running the better engine. That, in one sentence, is what ROE and ROCE try to measure. Both are profitability ratios — they judge how efficiently a business converts capital into profit — but they count the "pile of money" differently, and that difference is where the insight lives.
What the two ratios are
Let us define each in plain terms.
- ROE (Return on Equity) = net profit ÷ shareholders' equity. It asks: for every ₹100 that the owners have put into the business (and left there as retained profit), how much profit did the company earn this year?
- ROCE (Return on Capital Employed) = operating profit ÷ capital employed, where capital employed is equity plus debt. It asks: for every ₹100 of total capital at work — whether it came from owners or lenders — how much operating profit did the business generate?
The key distinction: ROE looks only at the owners' money, while ROCE looks at all the money at work, borrowed and owned together. ROE also uses net profit (after interest and tax); ROCE uses operating profit (before interest), because it is judging the whole capital base regardless of how that capital was financed.
An everyday analogy
Imagine you open a small tea stall. You put in ₹1,000 of your own savings. ROE is the return on your ₹1,000. Now suppose a friend lends you another ₹1,000, so the stall runs on ₹2,000 of total capital. ROCE is the return on the full ₹2,000, no matter whose money it was. If the stall is a good business, ROCE tells you the engine itself is strong. ROE then tells you how good the deal is for you, the owner — and borrowing cheaply can make your personal return look better than the stall's underlying quality.
A worked example with round numbers
Take a fictional company, BrightFMCG. Suppose it has:
- Shareholders' equity: ₹1,000 crore
- Debt: ₹0 (it is debt-free)
- Operating profit: ₹260 crore, and net profit ₹200 crore after tax
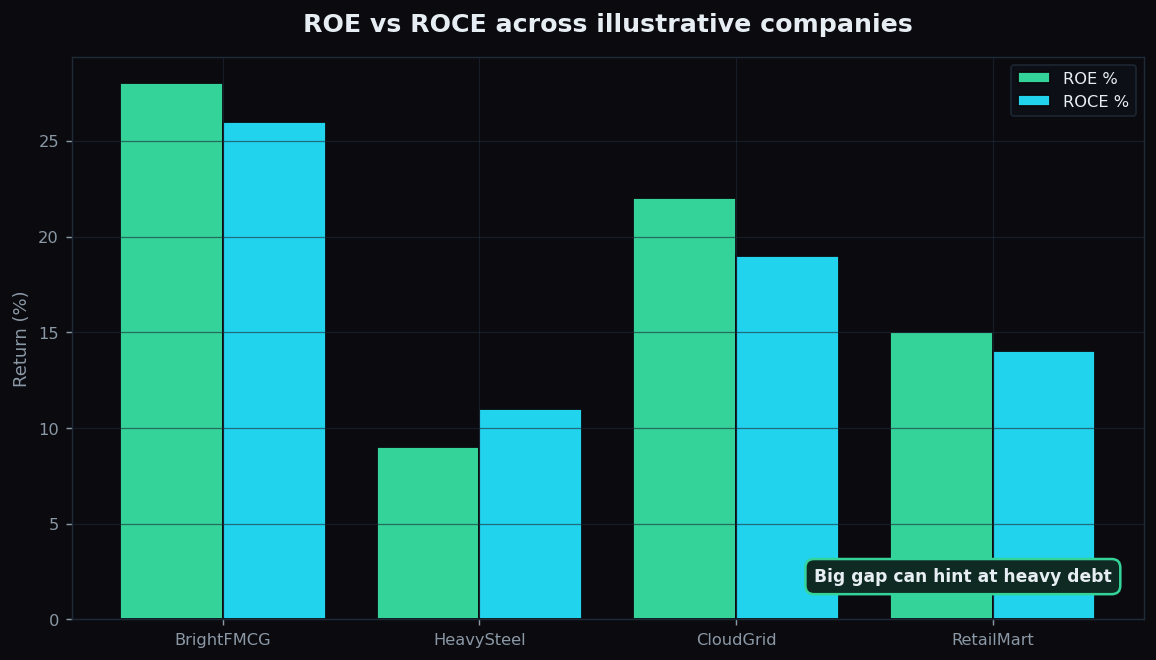
Its ROE is ₹200 ÷ ₹1,000 = 20%. Its capital employed is ₹1,000 + ₹0 = ₹1,000 crore, so ROCE is ₹260 ÷ ₹1,000 = 26%. Because the firm carries no debt, the two are close — the small gap just reflects operating-versus-net profit.
Now imagine a second firm, HeavySteel, that borrows heavily. Debt can lift ROE because profit is spread over a small equity base, while ROCE stays honest by counting the borrowed money too. When you see a high ROE but a much lower ROCE, leverage — the use of borrowed money — is often part of the story. The chart makes the pattern visible.
What they signal about quality
Consistently high ROCE is one of the cleaner signals of a genuinely good business. Because it strips out financing choices, a firm that earns, say, 20%-plus ROCE year after year is generating strong returns from its actual operations — not from clever borrowing. Investors often prize this because a high-ROCE company can reinvest its profits at high rates and compound its value over time.
ROE adds the shareholder's-eye view. A high ROE built on a strong ROCE is often read as high-quality: the business earns well and the owners keep a big share of it. A high ROE built on a modest ROCE and a mountain of debt is a different animal — the return exists, but so does the risk that comes with heavy borrowing.
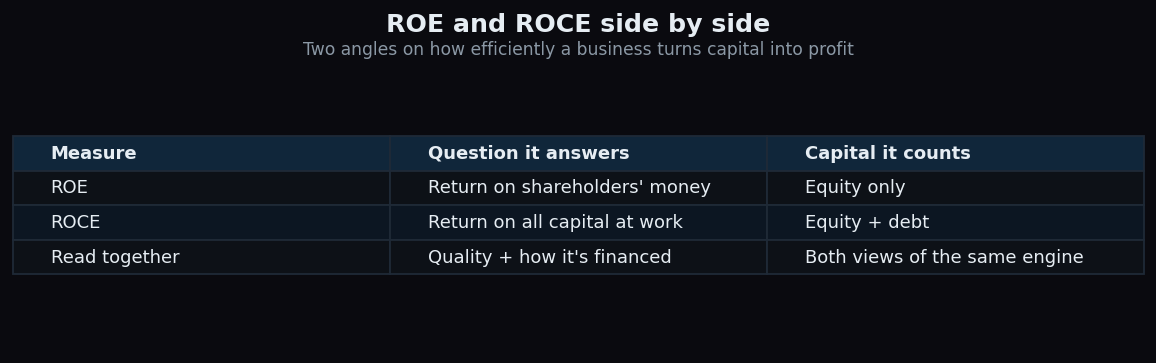
Reading them together is the whole trick. ROCE tells you how good the engine is; ROE tells you how good the ride is for the owner; and the gap between them tells you how much of the ride is being powered by debt.
Why context matters so much
Neither ratio has a single "good" value that works everywhere. A software firm with few physical assets can post enormous returns simply because it employs little capital, while a power utility with vast plants will structurally show lower figures. That does not make one better than the other — it makes them different businesses. The useful comparisons are:
- Against the company's own history. Rising or steady high returns are a healthier pattern than a slow decline.
- Against direct peers. Compare a bank with a bank, a cement maker with a cement maker — never across unrelated industries.
- Against the cost of capital. A business earning a ROCE below what its capital costs is, in effect, destroying value even if the number looks positive.
The honest catch
These ratios are powerful but not bulletproof.
- Debt can flatter ROE. A company can lift its ROE by borrowing more and buying back shares, shrinking the equity base. The return looks better while the risk quietly rises. Always check ROE against ROCE and the debt level.
- One-off items distort them. A single asset sale or a big write-down can spike or crater a year's profit, making the ratio misleading. Look at several years, not one.
- Book equity can be understated. After years of buybacks, equity can shrink so much that ROE looks spectacular for reasons that have little to do with operating strength.
- They ignore valuation. A wonderful business with a 30% ROCE can still be an expensive share. These ratios describe the business, not the price you pay for it.
Used with that awareness, ROE and ROCE are among the most revealing numbers a beginner can learn — a quick read on whether a business is a strong compounding engine or simply a leveraged one.
Quality ratios like ROE and ROCE reward patient, context-first reading — exactly the habit TrueTrend is built to encourage. You can start free and get plain-English context on the numbers that matter.
Key takeaways
- ROE = net profit ÷ equity — the return on the owners' money.
- ROCE = operating profit ÷ (equity + debt) — the return on all capital at work.
- ROCE judges the quality of the engine; ROE judges the ride for the shareholder.
- A high ROE with a much lower ROCE is often read as a sign of heavy leverage powering the returns.
- Both are only meaningful against a company's own history, its direct peers, and its cost of capital.
- Watch for debt, one-off items, and buybacks, which can flatter the numbers — and remember they describe the business, not the share price.
See these concepts on live market data — free
Create a free TrueTrend account to watch daily support/resistance levels, market regime, and option-positioning charts on NIFTY, BankNifty and 12 more instruments. Every level we publish is scored on a public scoreboard — misses included. No card required.
Free forever tier · daily levels with published hit-rates across every instrument. Descriptive market structure, not investment advice.
Not ready for an account? Get the daily levels by email.
One short email each market day — the indices' call wall, put wall, gamma flip and max pain, and how the last session's levels scored. Free, no account, unsubscribe anytime.
Descriptive market structure, not investment advice. We never share your email.