Sector Rotation Explained for Beginners
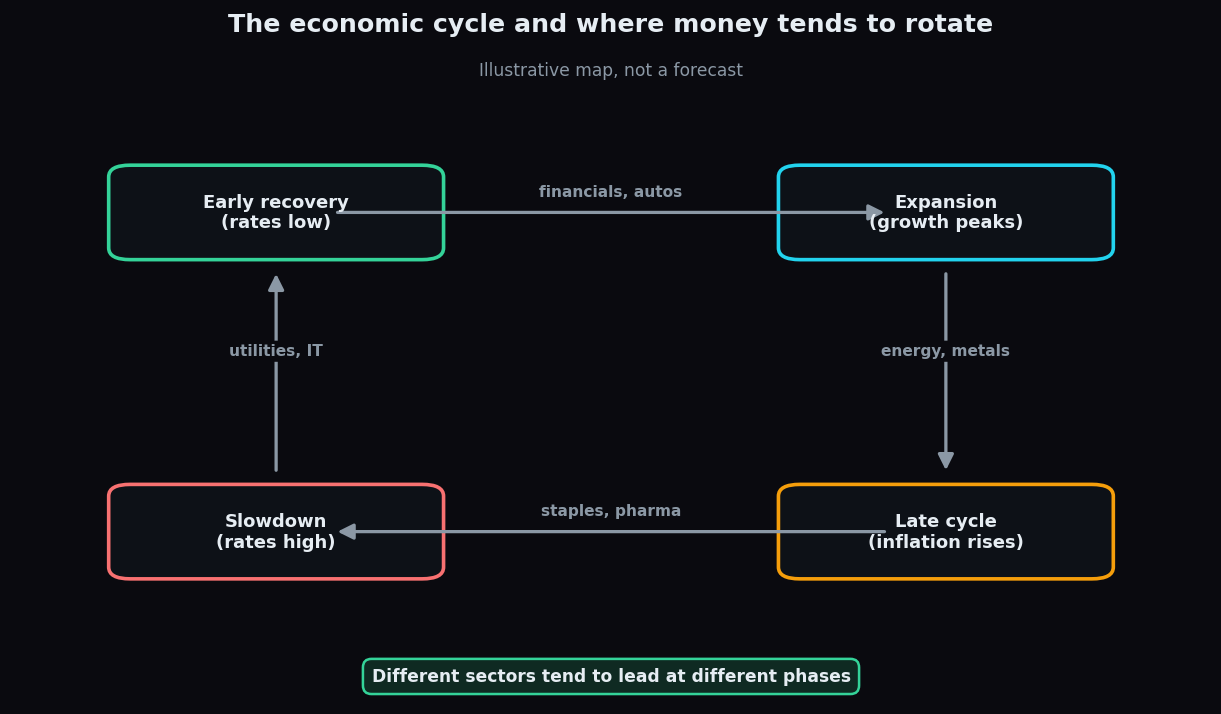
Money in the stock market rarely sits still. As the economy moves through its natural ups and downs, professional investors tend to shift their attention from one group of industries to another — parking cash where conditions look supportive and stepping back where they do not. This slow, cyclical hand-off is called sector rotation. Understanding it helps a beginner make sense of a puzzling market day when, say, banks are soaring while technology stocks sag. Every figure and label below is illustrative, chosen to teach the idea rather than predict anything.
What is a sector?
A sector is simply a group of companies that do similar work. Banks and lenders sit in the financials sector. Carmakers sit in autos. Drug companies sit in pharma. Grouping stocks this way lets us talk about broad forces — interest rates, fuel prices, consumer confidence — that push a whole batch of companies in the same direction at once.
Sector rotation, then, is the tendency for leadership to pass from one sector to another as the economy changes gears. It is less about a single stock and more about which neighbourhood of the market is in favour.
The economic cycle in four seasons
Economies breathe in a rough cycle: they recover, expand, overheat, then slow down, before recovering again. Think of it like four seasons that keep repeating. Different sectors tend to enjoy different seasons.
Here is the classic, textbook-style pattern (illustrative, and never as clean in real life):
- Early recovery. Interest rates are low and the economy is turning up. Rate-sensitive and economy-sensitive groups — financials, autos, and other consumer purchases people delay in hard times — often lead as optimism returns.
- Expansion. Growth is running hot and demand is broad. Industrials and technology — companies that benefit when businesses invest and spend — tend to do well.
- Late cycle. The economy is near its peak and prices are rising. Commodities such as energy and metals often shine because inflation lifts the prices of the raw materials they sell.
- Slowdown. Growth cools and caution sets in. Money tends to move toward defensives — pharma, consumer staples, and utilities — businesses whose products people buy no matter what the economy does.
Why it matters
A helpful analogy: imagine a farmer with several fields. In one season the rice field thrives; in another the wheat field does better. A thoughtful farmer pays attention to the season and does not expect every field to bloom at once. Sector rotation is the market's version of that. It explains a common beginner confusion — “the index barely moved, so why did my stock fall while my friend's jumped?” Often the answer is that they hold stocks in different sectors, and the season favoured one over the other.
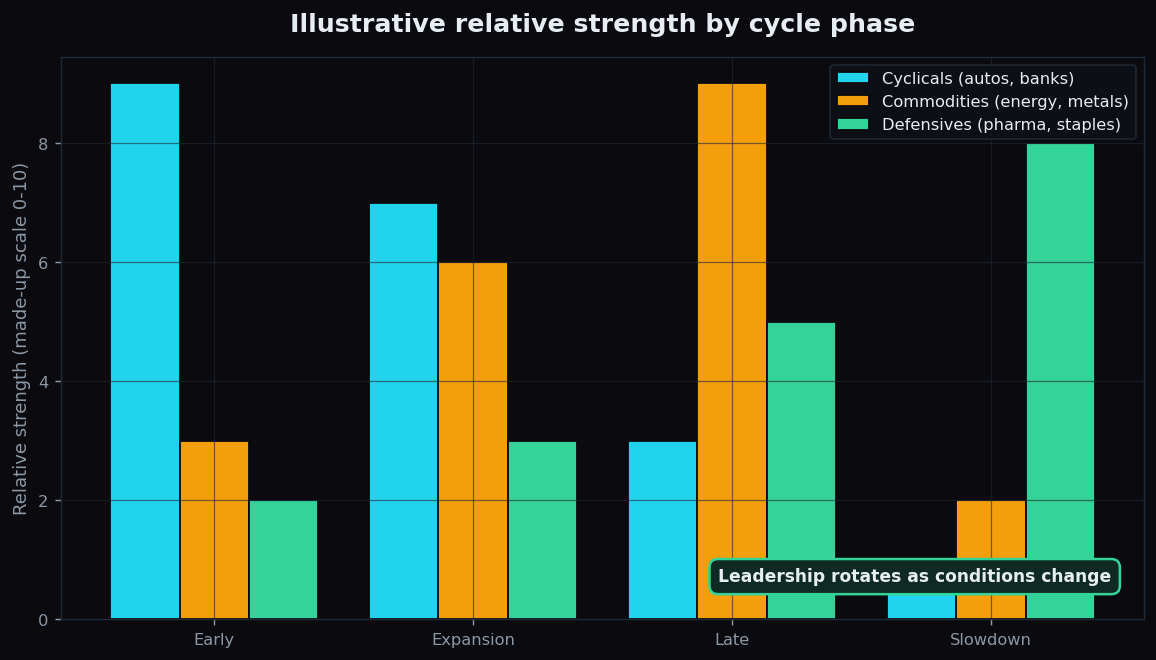
The grouped bars above make the hand-off visible. On this made-up 0–10 scale, cyclical sectors (banks, autos) show strength early, commodities peak later in the cycle, and defensives hold up best during a slowdown. No single group wins in every column — that rotation of leadership is the whole point.
How the idea is used
Analysts and portfolio managers watch several clues to guess where the economy sits in its cycle and which sectors the “season” may favour:
- Interest-rate direction. Falling rates often help financials and interest-sensitive buyers; rising rates can pressure them.
- Relative strength. Comparing how sector indices perform against the broad market shows where leadership is quietly shifting, sometimes before the headlines catch up.
- Commodity and inflation trends. Rising fuel and metal prices are a classic late-cycle tell.
- Breadth. Whether many sectors are rising together (broad expansion) or just a defensive few (a cautious market) hints at the phase.
A simple worked illustration: suppose an investor tracks three baskets — a cyclical basket, a commodity basket, and a defensive basket — each starting at an index value of 100. Over a slowdown quarter, the defensive basket drifts to 104 while the cyclical basket slips to 96. That 8-point relative gap is the kind of signal a rotation-watcher notices: leadership has quietly moved toward defensives. Again — illustrative numbers to show the mechanic, not a call on any real basket.
The honest catch
Sector rotation is a useful lens, not a crystal ball. Treat the tidy four-season diagram with healthy skepticism.
- The cycle is messy and irregular. Phases do not arrive on a schedule, overlap constantly, and sometimes skip. You only know for certain which phase you were in long after the fact.
- Markets look ahead. Prices often move before the economic data confirms a phase, so by the time a trend is obvious it may be partly finished.
- Every cycle has its own personality. A shock — a pandemic, a war, a policy surprise — can scramble the usual order entirely.
- Rotation says nothing about individual companies. A strong sector can still hold a weak business, and vice versa.
So the framework is best used to understand context — why the market is behaving the way it is — rather than as a precise timing device.
Reading the market's rotation starts with reading its structure clearly. TrueTrend turns dense market context into plain-English explainers and a transparent public scoreboard, so beginners can build real understanding before risking a rupee. Start exploring free at TrueTrend.
Key takeaways
- A sector is a group of similar companies; sector rotation is leadership passing from one sector to another as the economy changes gears.
- The economy moves in a rough cycle — recovery, expansion, late cycle, slowdown — and different sectors tend to lead in each phase.
- Cyclicals often lead early, commodities late, and defensives during slowdowns (all illustrative patterns).
- Rotation explains why your stock can fall while another rises even when the index is flat — they live in different sectors.
- It is a context lens, not a timing machine: cycles are irregular, markets look ahead, and every cycle differs.
- All labels and numbers here are teaching examples, not forecasts or advice.
See these concepts on live market data — free
Create a free TrueTrend account to watch daily support/resistance levels, market regime, and option-positioning charts on NIFTY, BankNifty and 12 more instruments. Every level we publish is scored on a public scoreboard — misses included. No card required.
Free forever tier · daily levels with published hit-rates across every instrument. Descriptive market structure, not investment advice.
Not ready for an account? Get the daily levels by email.
One short email each market day — the indices' call wall, put wall, gamma flip and max pain, and how the last session's levels scored. Free, no account, unsubscribe anytime.
Descriptive market structure, not investment advice. We never share your email.