Support and Resistance Explained Simply
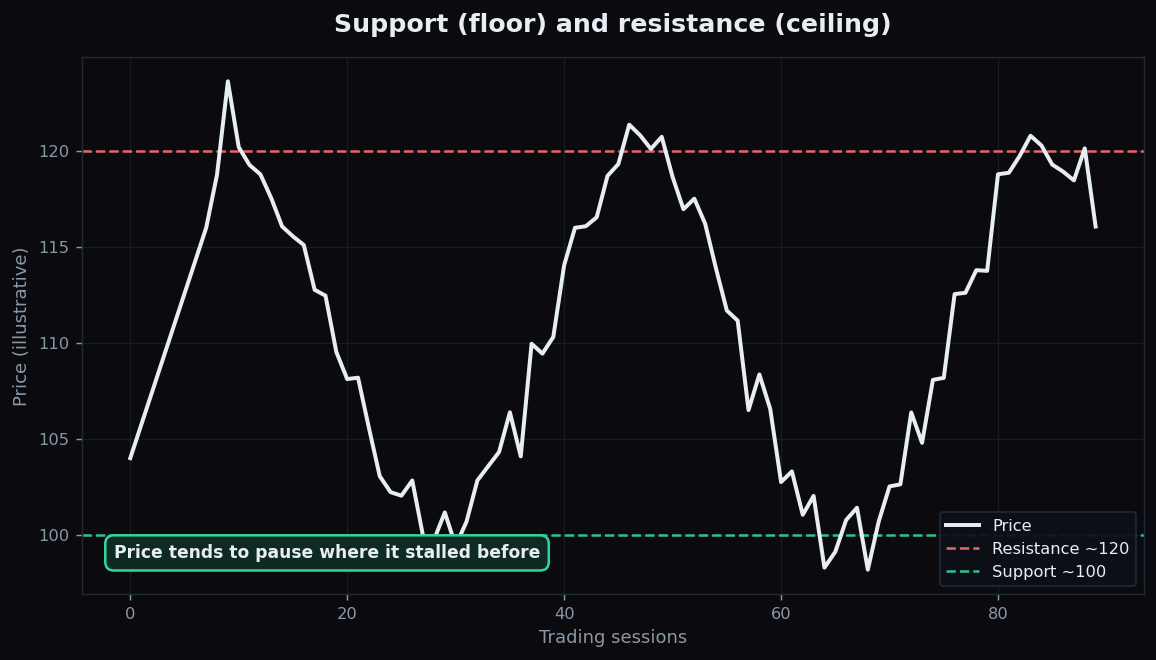
If you watch any price chart for long enough, you notice something odd: prices do not wander freely. They keep stalling at the same places, as if there were an invisible floor underneath and an invisible ceiling above. Those places have names — support and resistance — and they are among the first ideas every chart reader learns.
What support and resistance are
Support is a price level where falling prices have repeatedly stopped and bounced — a floor where buyers have shown up before. Resistance is the opposite: a level where rising prices have repeatedly stalled and turned back — a ceiling where sellers have shown up before. Neither is an exact line. Think of them as zones, a small band of prices rather than a single number.
A simple analogy: bounce a ball in a room. It keeps dropping to the floor and springing back up, and if you throw it upward it keeps bumping the ceiling and falling. Support is the floor; resistance is the ceiling. Price, like the ball, tends to travel between them until something changes the room.
Why these levels form
Support and resistance are not magic. They come from human memory and the orders that memory creates. A few honest reasons a level forms:
- Memory of pain and regret. People who bought near a low remember it. If price returns there, fresh buyers step in — recreating the support.
- Round numbers. Humans cluster orders at tidy figures like ₹500 or ₹1,000. So those prices often act as levels simply because everyone is watching them.
- Earlier turning points. A previous peak or trough is a price the whole market saw. Many participants place orders around it, which makes it "sticky" the next time.
In short, a level matters because enough people believe it matters and act accordingly. That is also why it is context, not a guarantee.
How chart readers use them
Support and resistance give a chart a frame. Instead of an endless scroll of numbers, you get reference points: "price has been bouncing between roughly ₹100 and ₹120." That frame helps describe where a move is in its range and where it might pause next. It is also where people often think about risk — a move that pushes decisively past a long-respected level is treated as meaningful information, because the old balance of buyers and sellers just shifted.
A worked example with round numbers
Here is an illustrative example — made-up numbers to teach the idea, not a recommendation. Imagine an index that, over several weeks, drops to about 20,000 four times and bounces each time, while topping out near 21,000 each time it rallies. A chart reader would label 20,000 as support and 21,000 as resistance, and describe the index as "range-bound between 20,000 and 21,000." Nothing about that description predicts the next move. It just names the floor and the ceiling that the crowd has been respecting.
Role reversal: when a level breaks
The most useful idea in this whole topic is what happens when a level breaks. When price pushes firmly above a resistance ceiling, that old ceiling often starts acting as a new floor — and vice versa. This is called role reversal, or "polarity."
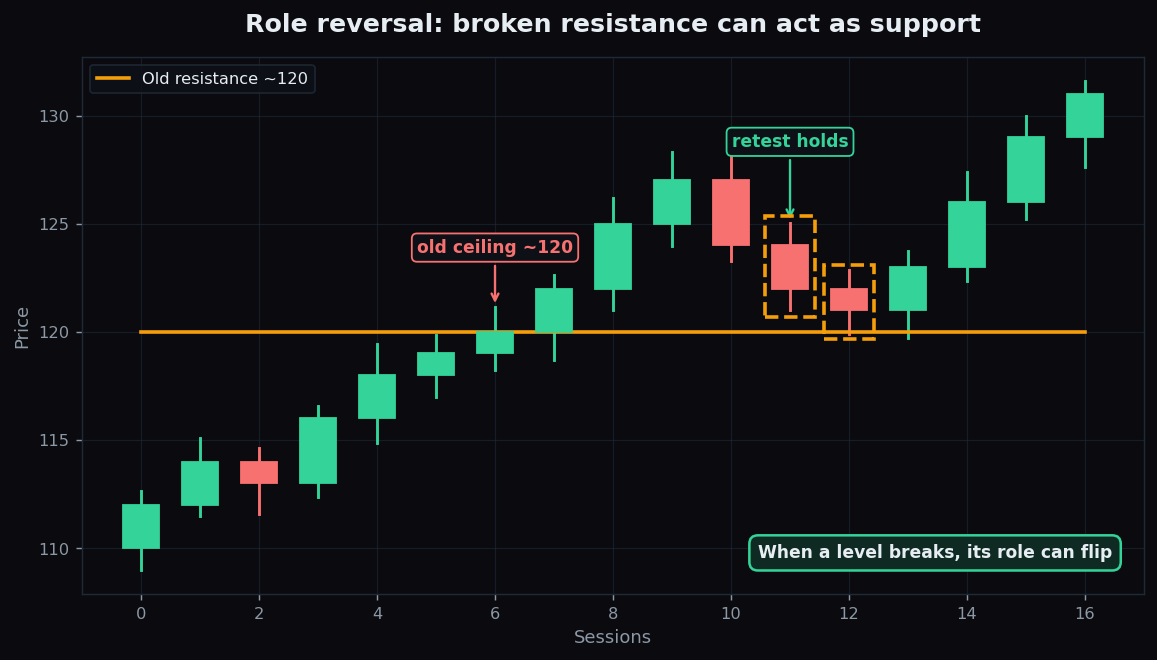
Why does this happen? Picture the ₹120 ceiling again. For weeks, sellers appeared there. Once price breaks above and holds, those sellers are gone — and people who missed the move now see ₹120 as a "good price." When price dips back to ₹120, fresh buyers step in, and the old ceiling holds as a floor. The level did not change; the crowd's relationship to it did.
The honest catch
Support and resistance are genuinely useful, but they are softer than they look:
- They are zones, not exact lines. Price can poke through a level by a little and still respect it. Drawing them is part art.
- They break — often. Every level holds until it does not. A floor is only a floor until price falls straight through it.
- "False breaks" happen. Price can pierce a level, suck people in, then snap back the other way.
- They are subjective. Two analysts may draw support a few points apart and disagree about whether it "held."
None of this makes the idea useless — it makes it a descriptive tool. Support and resistance describe where the crowd has reacted before. They never promise it will react the same way again.
Curious where well-known levels actually held versus where they failed? TrueTrend tracks level behaviour transparently and publishes the record on its public scoreboard — so you can weigh the evidence yourself.
Key takeaways
- Support is a floor where buyers have repeatedly appeared; resistance is a ceiling where sellers have repeatedly appeared.
- They form from memory, round numbers, and earlier turning points — levels matter because enough people act as if they do.
- Treat them as zones, not exact lines, and as context rather than prediction.
- Role reversal: broken resistance can become support, and broken support can become resistance.
- Levels break often and false breaks happen — the idea is descriptive, never a guarantee.
See these concepts on live market data — free
Create a free TrueTrend account to watch daily support/resistance levels, market regime, and option-positioning charts on NIFTY, BankNifty and 12 more instruments. Every level we publish is scored on a public scoreboard — misses included. No card required.
Free forever tier · daily levels with published hit-rates across every instrument. Descriptive market structure, not investment advice.
Not ready for an account? Get the daily levels by email.
One short email each market day — the indices' call wall, put wall, gamma flip and max pain, and how the last session's levels scored. Free, no account, unsubscribe anytime.
Descriptive market structure, not investment advice. We never share your email.