Types of Gaps: Common, Breakaway, Exhaustion
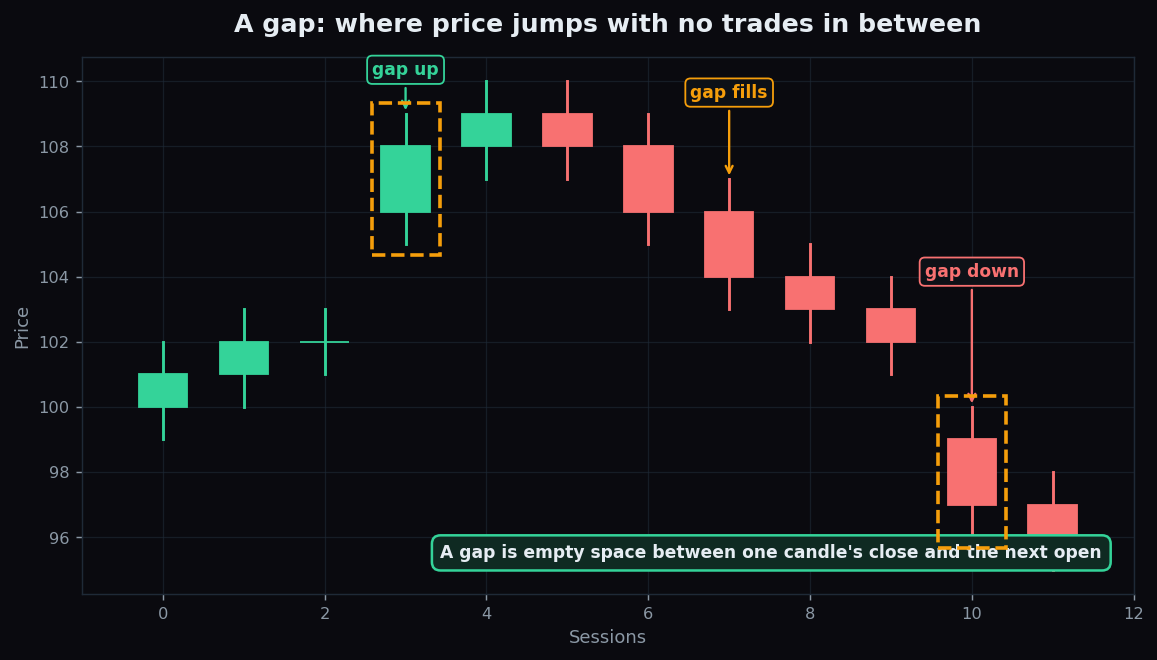
Open a daily chart and you will sometimes see a clean stripe of empty space between one candle and the next — price seems to teleport from one level to another with nothing in between. That empty space is a gap, and it is one of the most quietly informative things a chart can show you. Not every gap means the same thing, though. Learning to tell the types apart is a useful skill for any beginner reading charts.
What a gap actually is
A gap happens when a session opens at a price meaningfully away from where the previous session closed, leaving a range where essentially no trading took place. Most gaps form overnight: the market is shut for hours, but the world keeps moving. Earnings come out, global markets swing, news breaks. By the time trading reopens, everyone has already repriced the asset in their heads, so the first trade prints at a new level — and a gap appears.
An everyday analogy: imagine a shop that closes at 9 p.m. with bread priced at 100. Overnight a flour shortage hits the news. When the shutters go up at 9 a.m., the very first customer is charged 110. Nobody traded bread at 101 through 109 — the price simply jumped. That jump is the gap.
In the chart above, the highlighted boxes show a gap up (the open sits well above the prior candle's high) and later a gap down (the open sits well below the prior candle's low). The empty vertical space is the gap itself.
Gap fills — the idea you will hear about most
You will often hear traders say a gap got "filled." Filling a gap simply means price later trades back across that empty zone, retracing to the level where the jump began. In the first chart, the middle candles drift back down into the gap-up zone — that is a fill in progress.
Gaps fill surprisingly often, because a jump driven by a burst of emotion can fade once cooler heads return. But "gaps tend to fill" is a tendency, not a law. Some gaps fill within hours; some take months; some never fill at all. Treating "it must fill" as a certainty is one of the classic beginner traps.
The three classic gap types
Chartists group most gaps into three families based on where in a move they appear. The same empty space can mean very different things depending on its location.
1. Breakaway gap
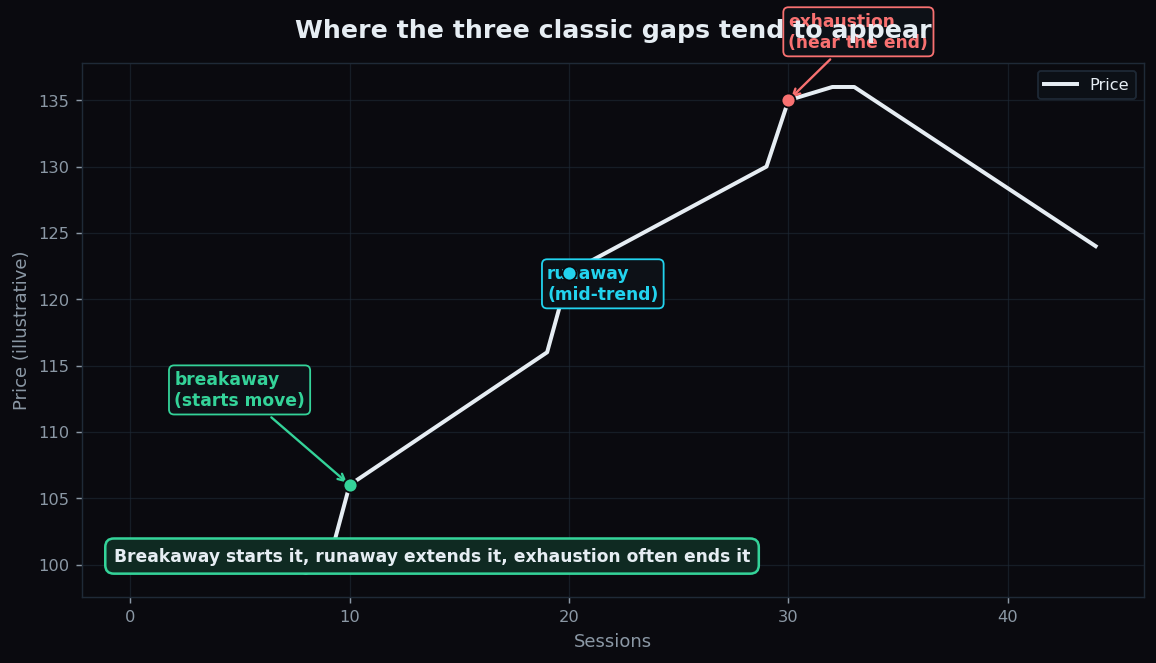
A breakaway gap appears at the start of a new move, when price leaps out of a long sideways range or a well-known level. It says the market has made up its mind after a period of indecision. Breakaway gaps that come with heavy participation are the ones chartists take most seriously, and they are the least likely of the three to fill quickly — the jump represents a genuine change of view, not just a mood swing.
2. Runaway (continuation) gap
A runaway gap, also called a continuation or measuring gap, appears in the middle of an already-established move. The trend is underway, fresh participants pile in, and price jumps again in the same direction. Because it often shows up roughly halfway through a move, some traders use it as a rough waypoint — a sign the trend still has energy.
3. Exhaustion gap
An exhaustion gap appears near the end of a move — a final, almost desperate jump as the last latecomers rush in. It can look identical to a runaway gap in the moment; the difference only becomes clear afterwards, when price stalls and reverses instead of continuing. An exhaustion gap that quickly fills is often read as the move running out of fuel.
A worked example with round numbers
Picture a stock stuck between 98 and 100 for weeks. One morning it opens at 106 — a clean jump above the range. That is a breakaway gap; the standoff is over. Over the next stretch it climbs to 116, then one day opens at 122: a runaway gap, mid-trend, with buyers still in charge. It pushes to 130, and then gaps up once more to 135 — but this time it stalls and slips back. In hindsight, that last jump was an exhaustion gap.
Notice the honest part: while it was happening, the 122 gap and the 135 gap looked the same. Only the behaviour after the gap told you which was which. These numbers are illustrative, chosen to make the sequence easy to follow — not a prediction about any real stock.
The honest catch
- Labels are clear only in hindsight. A runaway and an exhaustion gap can be indistinguishable in the moment; the name is assigned after the fact.
- "Gaps always fill" is a myth. Many fill, but plenty do not, and timing is unpredictable.
- Context and participation matter. A gap on heavy activity in a meaningful spot carries more information than a small gap in a thin, sleepy market.
- Gaps are descriptive, not instructions. They tell you something happened; they do not tell you what to do.
For readers who also want to understand why price often reprices overnight, our explainer on how global cues shape the opening pairs naturally with this one.
Gaps are easier to interpret when you can study how moves played out across many sessions rather than one cherry-picked chart. TrueTrend keeps a transparent, education-first scoreboard so you can see market behaviour over time — explore it and judge the patterns for yourself.
Key takeaways
- A gap is empty space where price jumped from one session's close to the next open, usually on overnight news.
- Filling a gap means price later retraces across that empty zone — common, but never guaranteed.
- Breakaway gaps start a move, runaway gaps extend it, and exhaustion gaps often end it.
- Runaway and exhaustion gaps look alike in the moment; only later behaviour separates them.
- Gaps describe what happened — this article is education, not advice.
See these concepts on live market data — free
Create a free TrueTrend account to watch daily support/resistance levels, market regime, and option-positioning charts on NIFTY, BankNifty and 12 more instruments. Every level we publish is scored on a public scoreboard — misses included. No card required.
Free forever tier · daily levels with published hit-rates across every instrument. Descriptive market structure, not investment advice.
Not ready for an account? Get the daily levels by email.
One short email each market day — the indices' call wall, put wall, gamma flip and max pain, and how the last session's levels scored. Free, no account, unsubscribe anytime.
Descriptive market structure, not investment advice. We never share your email.