What Is a Stock Market Index? Nifty and Sensex Explained
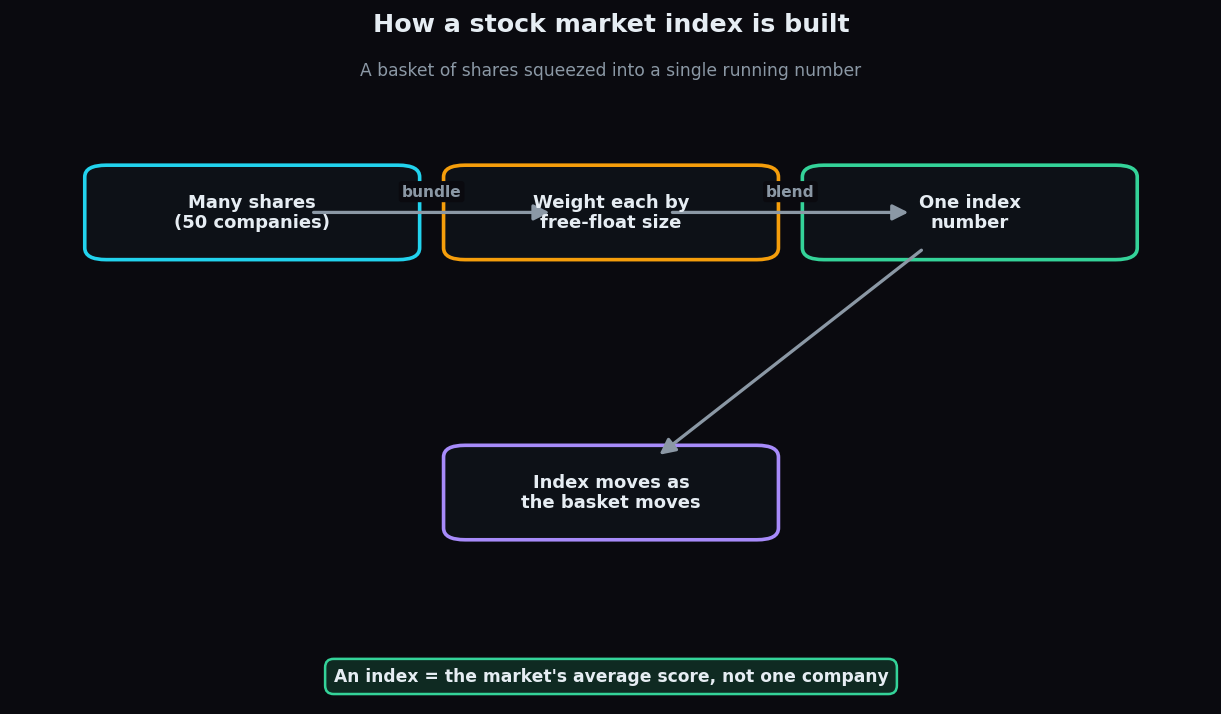
Every evening the news says “the Nifty closed up 120 points” or “the Sensex fell 1%” — but Nifty and Sensex are not companies you can own. They are stock market indices: single numbers that summarise how a whole group of shares moved together. This post explains what an index really is, how its number is built, and why it climbs or sinks.
What a stock market index actually is
An index is a basket of shares tracked as one running score. Instead of checking 50 different companies one by one, you watch a single figure that blends them all. Think of it like a cricket team’s total score. No single batsman is the score — the score is what you get when you add up everyone’s contribution. An index works the same way: it is the combined scoreboard for a chosen list of companies.
In India the two famous ones are the Nifty 50 (50 large companies, run by NSE) and the Sensex (30 large companies, run by BSE). The list of companies inside an index is curated and reviewed regularly, so it stays a fair snapshot of the bigger market.
How the number is built: free-float weighting
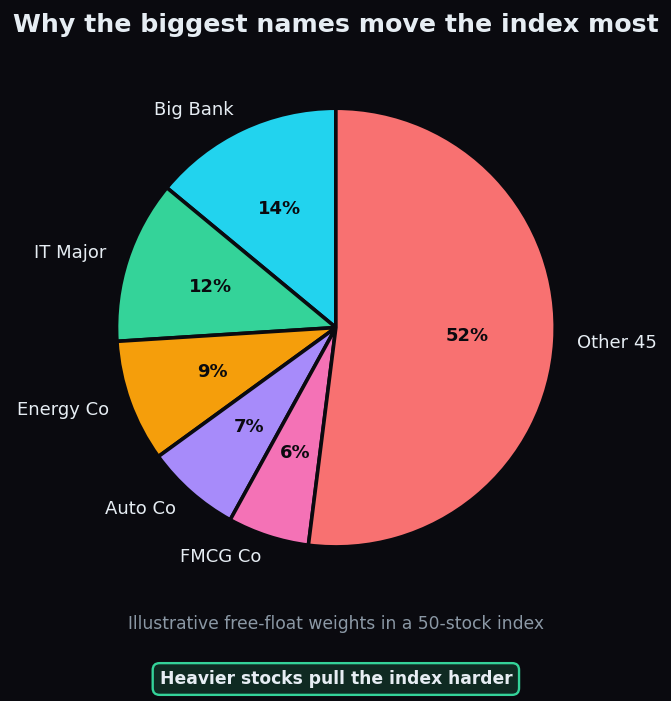
Here is the part most beginners miss: not every company in an index counts equally. Bigger companies push the index more. The common method is free-float market-capitalisation weighting. Let us unpack that term:
- Market capitalisation (market cap) = share price × number of shares. It is the total market value of a company.
- Free-float = only the shares that are actually available to trade publicly, excluding promoter or government holdings that rarely change hands.
So a company’s weight in the index is its free-float market value divided by the total free-float value of the whole basket. A larger, more freely traded company gets a larger weight, and its daily move tugs the index harder.
A worked example with round numbers
Imagine a tiny index of just three companies (all figures invented for teaching):
- Apex Bank: free-float value ₹6,00,000 crore
- Bright IT: free-float value ₹3,00,000 crore
- Coastal Energy: free-float value ₹1,00,000 crore
The total is ₹10,00,000 crore. So the weights are Apex 60%, Bright 30%, Coastal 10%. Now suppose in one day Apex rises 2%, Bright falls 1%, and Coastal rises 5%. The index move is the weighted average:
(0.60 × +2%) + (0.30 × −1%) + (0.10 × +5%) = +1.2% − 0.3% + 0.5% = +1.4%.
Notice that little Coastal jumped 5% but barely nudged the index, while Apex’s modest 2% did most of the lifting. That is free-float weighting in action: size decides influence. To turn this percentage into the points you see on TV, the index is scaled against a fixed starting value (a base) so the same basket can be compared across years.
Why an index matters
An index does several useful jobs at once:
- A market thermometer. One glance tells you whether large companies broadly rose or fell, without reading 50 separate quotes.
- A benchmark. Funds and investors compare their own results against the index to see if they did better or worse than “the market.”
- A building block. Index funds, exchange-traded funds, and Nifty/Sensex derivatives are all built on top of these numbers.
- A mood gauge. Because it blends many companies, it reflects broad sentiment rather than one firm’s news.
The honest catch
An index is a summary, and summaries hide detail. Keep these limits in mind:
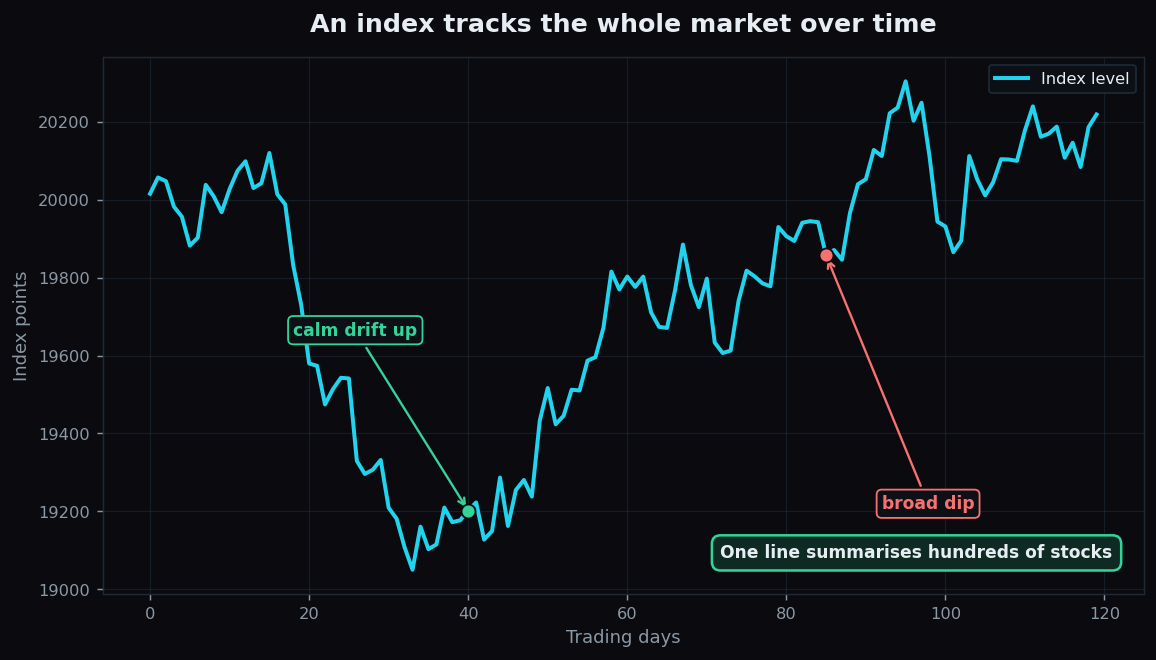
- It can mask the average stock. Because heavy names dominate, the index can rise even on a day when most companies actually fell — a few giants simply outweighed the crowd.
- It is concentrated. In a free-float-weighted index, a handful of the largest companies can make up a big share of the whole. The index leans on them.
- The membership changes. Companies get added and removed during periodic reviews, so today’s Nifty is not made of the same names as a decade ago.
- It says nothing about you. “The market is up” does not mean any specific holding is up. The index describes the basket, not your situation.
Understanding what is inside the number is what turns a headline into real understanding. The same logic shows up across the market — for instance, how overnight global signals feed into the open, which you can read about in how Gift Nifty reflects global cues.
Want to see how the headline index level connects to the structure underneath it? TrueTrend turns raw market data into plain-English context for learners — you can create a free account to explore it.
Key takeaways
- An index like Nifty or Sensex is a single number summarising a curated basket of shares.
- Most major indices use free-float market-cap weighting, so larger, freely traded companies move the index more.
- The index move is a weighted average of its members’ moves, scaled against a fixed base to read as points.
- It is useful as a thermometer, a benchmark, and a building block — but it can hide what the average stock did and leans heavily on a few giants.
- Knowing what is inside the number matters more than the number itself.
See these concepts on live market data — free
Create a free TrueTrend account to watch daily support/resistance levels, market regime, and option-positioning charts on NIFTY, BankNifty and 12 more instruments. Every level we publish is scored on a public scoreboard — misses included. No card required.
Free forever tier · daily levels with published hit-rates across every instrument. Descriptive market structure, not investment advice.
Not ready for an account? Get the daily levels by email.
One short email each market day — the indices' call wall, put wall, gamma flip and max pain, and how the last session's levels scored. Free, no account, unsubscribe anytime.
Descriptive market structure, not investment advice. We never share your email.