What Is Beta? A Stock's Swing vs the Market
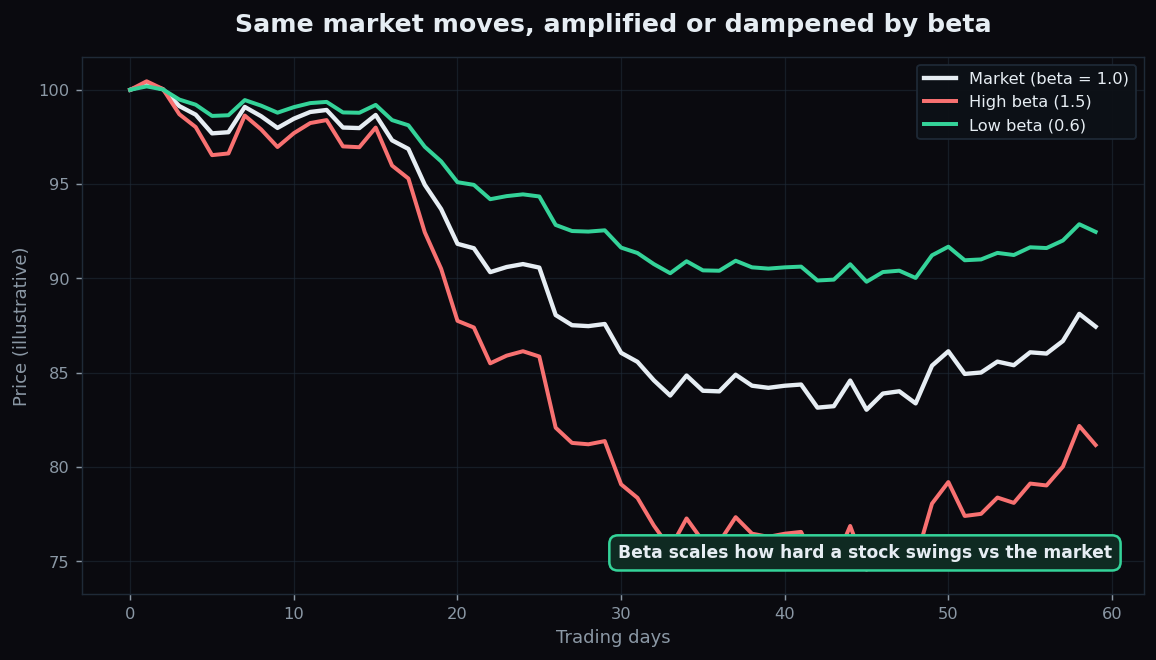
Some stocks jump around like a small speedboat in choppy water. Others barely rock, like a heavy ferry. Beta is the single number that tries to capture this difference — it measures how much a stock tends to swing compared with the market as a whole. It will not tell you which way a stock is heading, but it is one of the most useful shorthand descriptions of a stock's personality. Every number in this post is illustrative, picked to explain the idea rather than describe any real company.
What beta actually measures
Beta compares a stock's typical move to the market's typical move. The market itself — think of a broad index like the Nifty 50 — is the yardstick, and it is defined to have a beta of exactly 1.0. A stock's beta answers a simple question: when the market moves by a certain amount, how much does this stock usually move?
- Beta = 1.0: the stock tends to move roughly in step with the market.
- Beta below 1 (say 0.6): the stock tends to move less than the market — calmer, steadier.
- Beta above 1 (say 1.5): the stock tends to move more than the market — swingier in both directions.
Notice in the chart that all three lines follow the same ups and downs — they respond to the same market. Beta only changes the size of the response, not its direction. The high-beta line exaggerates every wiggle; the low-beta line mutes it.
An everyday analogy
Imagine the market is a song playing in a room, and each stock has its own volume knob. A stock with beta 1.0 plays the song at normal volume. Beta 0.6 turns the volume down — you still hear the same tune, just softer. Beta 1.5 cranks it up — the same melody, but louder and more intense. The song (the market's direction) is shared; beta is just how loud each stock plays it.
A worked example with round numbers
Suppose on a given day the market rises 2%. Using illustrative betas:
- A stock with beta 1.0 would, on average, rise about 2% — matching the market.
- A stock with beta 0.6 would tend to rise about 1.2% (0.6 × 2%) — a gentler move.
- A stock with beta 1.5 would tend to rise about 3% (1.5 × 2%) — an amplified move.
Crucially, the same math runs in reverse. If the market falls 2%, the beta-1.5 stock would tend to fall about 3%, while the beta-0.6 stock would tend to fall about 1.2%. Higher beta means bigger swings both ways — more thrilling on the way up, more painful on the way down. Beta describes volatility, not a one-way ticket.
Why beta matters
Beta is popular because it packs a lot of intuition into one figure:
- It describes temperament. Before you even look at a price chart, beta hints at how bumpy the ride is likely to be.
- It helps size expectations. Knowing a stock has a high beta prepares you for larger daily moves, so a scary-looking drop feels less like a surprise.
- It shapes a portfolio's overall feel. A basket full of high-beta names will tend to swing hard with the market; mixing in low-beta names can smooth the ride. This is a description of behaviour, not a suggestion about what anyone should hold.
- It feeds classic finance models. Beta is a core input in textbook models that estimate the return investors might demand for taking on market risk.
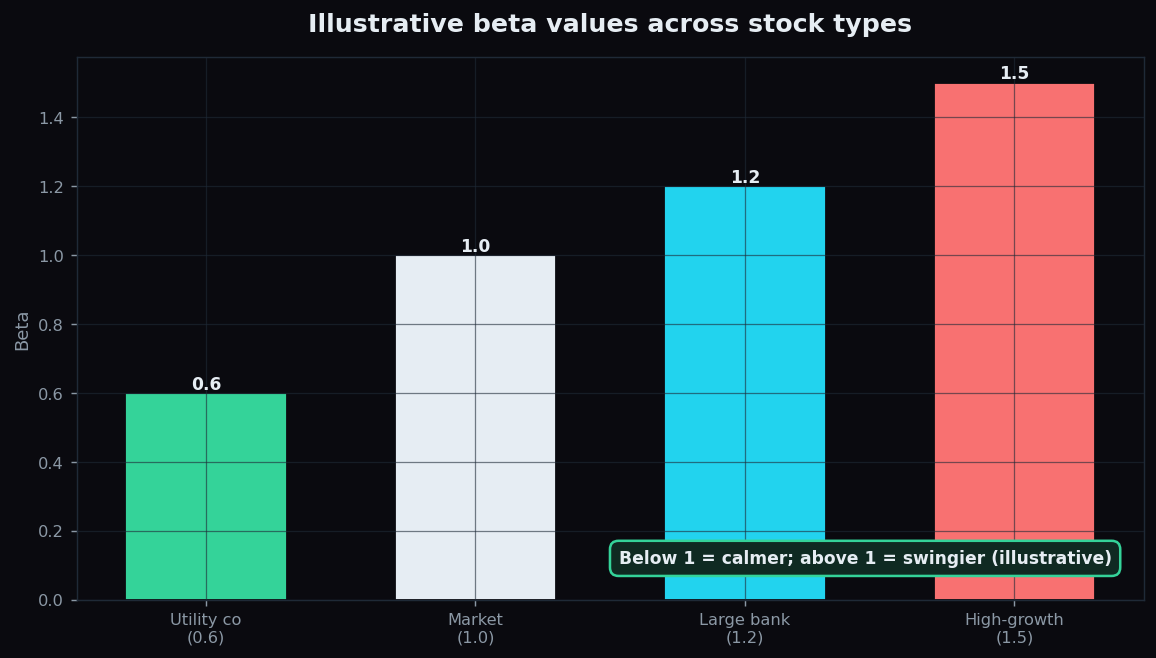
Which stocks tend to sit where? Steady, essential businesses — utilities, consumer staples — often carry lower betas because demand for their products barely changes with the economy. Fast-growing or economy-sensitive companies often carry higher betas. These are broad tendencies, not rules, and the illustrative values in the chart above simply show the typical spread.
The honest catch
Beta is handy, but it is a rear-view mirror, and it hides a lot.
- It is backward-looking. Beta is calculated from past price moves. A company's beta can change as its business, debt, or industry changes, so yesterday's number may not fit tomorrow.
- It only measures market-linked risk. Beta ignores company-specific dangers — a fraud, a failed product, a lawsuit. A low-beta stock is not automatically “safe.”
- It says nothing about direction or value. A high beta does not mean a stock will rise; it only means it will likely move a lot. Beta is silent on whether a stock is cheap or expensive.
- The measurement window matters. Beta calculated over one year can differ from beta over five years, so two sources may quote different numbers for the same stock.
Used well, beta is a quick label for “how jumpy” — a starting point for understanding a stock's behaviour, never the whole story.
Getting comfortable with risk language like beta is what separates guessing from understanding. TrueTrend turns market concepts into plain-English explainers and backs its analytics with a transparent public scoreboard, so beginners can learn the mechanics first. Start free at TrueTrend.
Key takeaways
- Beta measures how much a stock tends to swing versus the market, which is fixed at a beta of 1.0.
- Below 1 = calmer than the market; above 1 = swingier than the market; around 1 = moves in step.
- Higher beta amplifies moves in both directions — bigger gains and bigger drops.
- Beta describes volatility, not direction, value, or safety.
- It is backward-looking, can change over time, and ignores company-specific risks.
- All beta values and percentages here are illustrative teaching examples, not advice.
See these concepts on live market data — free
Create a free TrueTrend account to watch daily support/resistance levels, market regime, and option-positioning charts on NIFTY, BankNifty and 12 more instruments. Every level we publish is scored on a public scoreboard — misses included. No card required.
Free forever tier · daily levels with published hit-rates across every instrument. Descriptive market structure, not investment advice.
Not ready for an account? Get the daily levels by email.
One short email each market day — the indices' call wall, put wall, gamma flip and max pain, and how the last session's levels scored. Free, no account, unsubscribe anytime.
Descriptive market structure, not investment advice. We never share your email.