Working Capital Explained: The Cash a Business Runs On
Every business, from a roadside chai stall to a listed factory, lives in the gap between paying its suppliers and getting paid by its customers. To survive that gap, it needs a cushion of short-term money. That cushion has a name: working capital. It is one of the simplest ideas in fundamental analysis, and one of the most revealing about whether a company can actually keep its doors open day to day.
What working capital actually is
Working capital is a single subtraction:
- Current assets — things the business owns that turn into cash within about a year: cash itself, money customers owe it (receivables), and goods on the shelf (inventory).
- Current liabilities — bills due within about a year: money owed to suppliers (payables) and short-term borrowings.
Subtract the second from the first and you get net working capital:
Working capital = current assets − current liabilities.
If that number is positive, the company has more short-term resources than short-term bills. If it is negative, its near-term bills are larger than the assets meant to cover them — which may be fine or may be a warning, depending on the business.
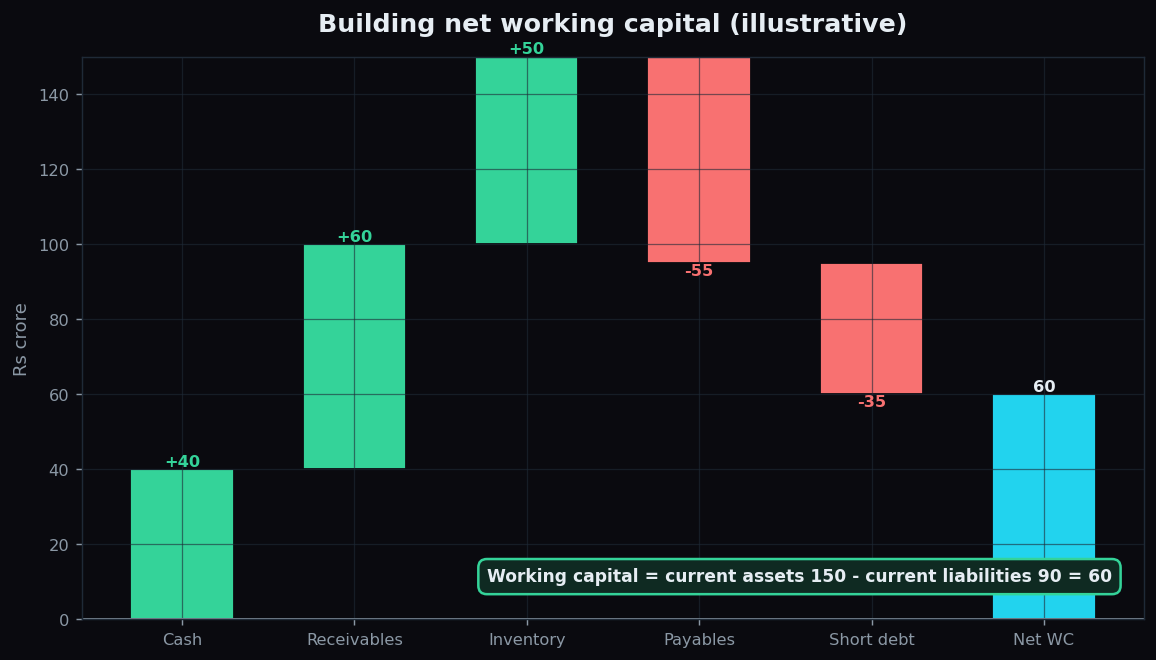
The chart above walks through an illustrative example. Cash of 40, receivables of 60 and inventory of 50 add up to current assets of 150. Payables of 55 and short-term debt of 35 add up to current liabilities of 90. Net working capital is 150 − 90 = 60 (all figures in rupees crore, and entirely made up to teach the idea).
Why it matters
Think of a small restaurant. It buys vegetables, rice and gas today, cooks through the week, and only collects the full month’s payment from a corporate catering client thirty days later. In between, rent and salaries still fall due. Working capital is the money that keeps the kitchen running during that wait. Run out of it and the restaurant cannot buy tomorrow’s vegetables, no matter how profitable the recipe looks on paper.
This is the crucial point for beginners: a company can be profitable and still fail if it runs out of working capital. Profit is measured over a whole year; bills are due this week. Businesses that grow too fast sometimes choke precisely because every new order ties up more cash in inventory and receivables before the payment arrives.
The operating cycle: how the cash moves
To see where the money gets stuck, analysts break the journey from cash to inventory to sale and back to cash into three measures, usually expressed in days:
- Inventory days (DIO) — how long goods sit before they are sold.
- Receivable days (DSO) — how long customers take to pay after buying.
- Payable days (DPO) — how long the company itself takes to pay its suppliers.
Combine them and you get the cash conversion cycle: the number of days a rupee is tied up in operations before it comes back as cash.
Cash cycle = inventory days + receivable days − payable days.
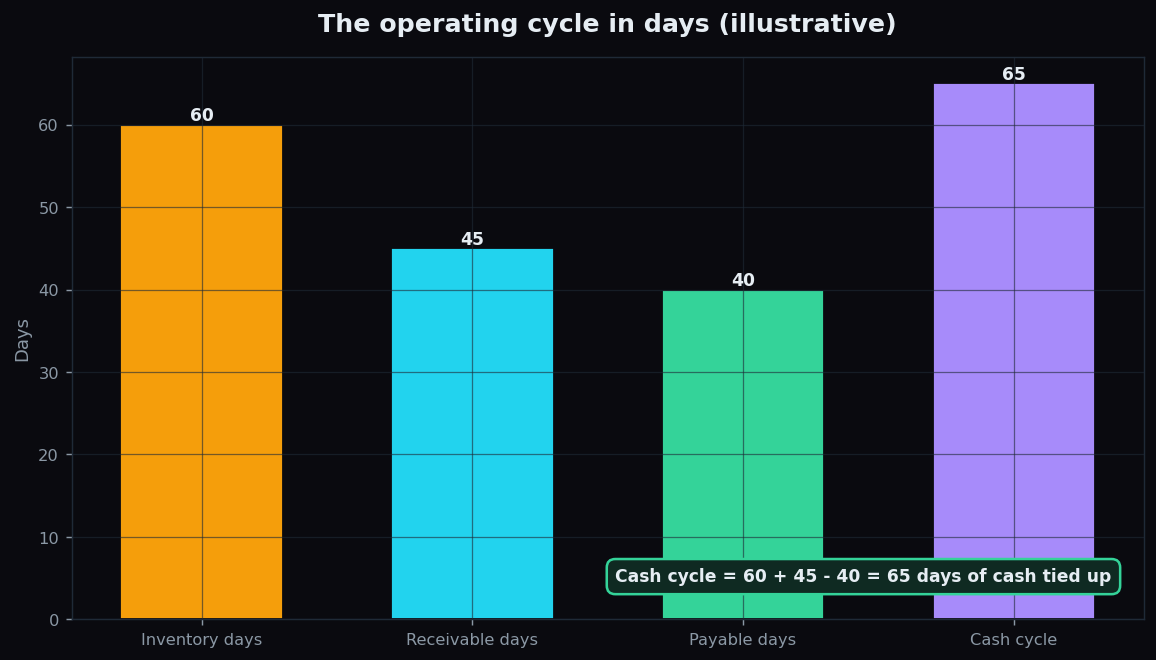
Using the illustrative figures above: goods sit for 60 days, customers pay after 45 days, and the company pays its own suppliers after 40 days. The cash cycle is 60 + 45 − 40 = 65 days. For roughly two months, the business is funding its own operations before the cash returns. A shorter cycle means cash comes back faster; a longer one means more money is locked up just to stay in business.
How investors use it
Because working capital describes short-term health, it is read in context rather than as a single verdict:
- Trend over time. Is the cash cycle stretching out year after year? That can mean unsold stock is piling up or customers are paying later.
- Comparison within an industry. A supermarket often runs on negative working capital — it sells goods for cash long before it pays suppliers — while a heavy-machinery maker may need large positive working capital. Neither is automatically better; it reflects how the business works.
- Quality of the assets. Receivables only help if customers actually pay, and inventory only helps if it actually sells. A big current-assets number full of stale stock can flatter the picture.
The honest catch
Working capital is a snapshot, not a movie. A balance sheet shows one single day, often the last day of the financial year, and companies can tidy that day up. More working capital is not always “good” either — a mountain of slow-moving inventory and overdue receivables inflates current assets while quietly signalling trouble. And the ideal level is deeply industry-specific, so a number that looks alarming in one sector can be perfectly normal in another. Treat it as one lens among many, and always ask why the number is what it is.
Working capital is the plumbing behind a company’s reported profit. If you want to keep building that intuition with plain-English explainers and a transparent view of Indian market structure, you can explore TrueTrend’s education tools by creating a free account.
Key takeaways
- Working capital = current assets − current liabilities — the short-term cushion that keeps a business running.
- A company can be profitable yet still fail if it runs out of working capital, because bills are due long before the year’s profit is counted.
- The cash conversion cycle (inventory days + receivable days − payable days) shows how many days cash is locked up in operations.
- Read it as a trend and against industry peers, not as a single good-or-bad number.
- Bigger is not always better: stale inventory and unpaid receivables can inflate the figure while hiding real problems.
See these concepts on live market data — free
Create a free TrueTrend account to watch daily support/resistance levels, market regime, and option-positioning charts on NIFTY, BankNifty and 12 more instruments. Every level we publish is scored on a public scoreboard — misses included. No card required.
Free forever tier · daily levels with published hit-rates across every instrument. Descriptive market structure, not investment advice.
Not ready for an account? Get the daily levels by email.
One short email each market day — the indices' call wall, put wall, gamma flip and max pain, and how the last session's levels scored. Free, no account, unsubscribe anytime.
Descriptive market structure, not investment advice. We never share your email.