ADX Explained: How to Measure Trend Strength
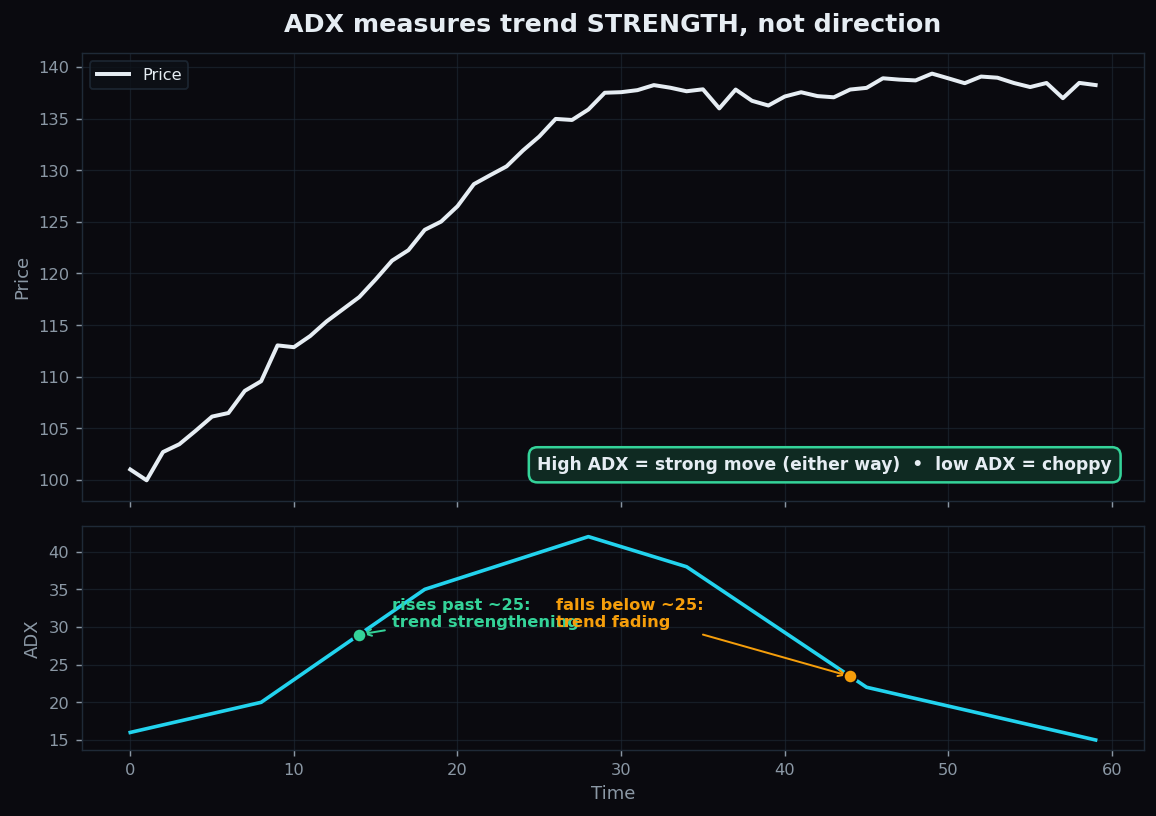
Most indicators try to tell you which way a market is going. The ADX answers a different and often more useful question: is the market trending strongly at all, or is it just drifting sideways? Knowing the difference matters, because the tools and tactics that work in a strong trend tend to fail in a flat, choppy range — and vice versa.
What ADX is
ADX stands for Average Directional Index. It is a number that moves between 0 and 100 and measures trend strength — how forceful a move is — without telling you the direction. A reading of 40 means “a strong trend is underway,” but it does not say whether that trend is up or down. Both a powerful rally and a brutal sell-off can produce a high ADX.
This is the single most common misunderstanding, so it is worth repeating: ADX is a strength meter, not a compass. A rising ADX means the current move — whichever way it points — is gaining power. A falling ADX means the move is losing power and the market is going quiet.
As a rough field guide, many chart readers use these zones (the exact numbers are conventions, not laws):
- Below 20–25: weak or absent trend — the market is ranging or chopping.
- Above 25: a trend is present and has some real strength.
- Above 40–50: a strong, well-established trend.
Where direction comes from: +DI and −DI
ADX is actually the calm summary of two more excitable lines that do carry direction:
- +DI (the Positive Directional Indicator) measures the strength of upward movement — loosely, buying pressure.
- −DI (the Negative Directional Indicator) measures the strength of downward movement — loosely, selling pressure.
The idea is simple. When +DI is above −DI, upward force is winning, so the directional bias is up. When −DI is above +DI, downward force is winning. ADX itself is then derived by smoothing the gap between these two lines: a wide gap (one side clearly dominating) gives a high ADX, while a narrow gap (a tug-of-war) gives a low ADX.
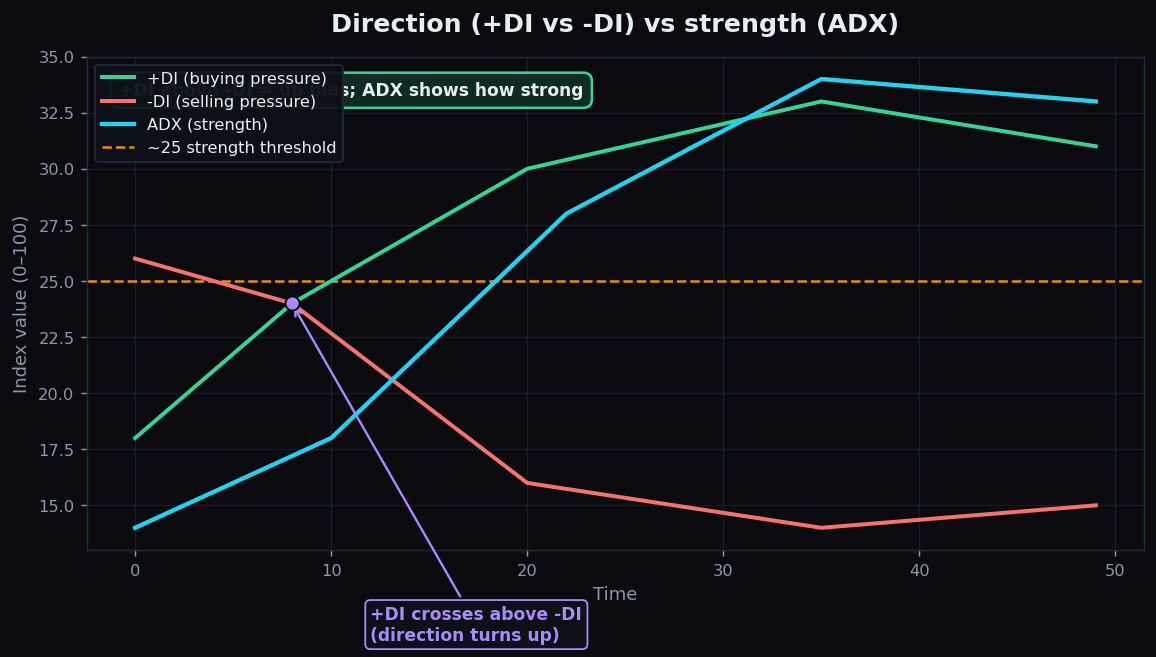
So the full picture comes from reading both layers together: the +DI versus −DI relationship gives direction, and the ADX line gives the conviction behind it.
An everyday analogy
Imagine you are watching a river. The direction the water flows is like +DI versus −DI — you can see which way it is heading. The ADX is the speed of the current. A fast current (high ADX) carries a boat strongly in whatever direction it is already going. A slow, swirling current (low ADX) leaves the boat drifting and turning in place. Crucially, the speedometer never tells you north from south; it only tells you how hard the water is pushing.
A worked example with round numbers
Suppose you are watching an index and read three numbers off the chart:
- +DI = 30, −DI = 15, ADX = 18. Upward force is clearly larger than downward force, so the bias is up — but ADX at 18 is below 25, so the trend is still weak. The move lacks conviction; the market may just be drifting up gently.
- A few sessions later: +DI = 34, −DI = 12, ADX = 38. The gap between the directional lines has widened and ADX has climbed past 25 toward 40. Now the up-move has genuine strength behind it.
- Later still: +DI = 22, −DI = 20, ADX = 16. The two lines have converged and ADX has collapsed. Strength has drained out of the move; the market is back to a sideways tug-of-war.
These are illustrative numbers chosen to show the pattern, not a recommendation. The lesson is the sequence: direction (the DI lines) and strength (ADX) tell a fuller story together than either does alone.
Why it matters
ADX is most valuable as a filter. Trend-following tools — breakouts, moving-average crossovers, and the like — only do well when a trend actually exists. By checking ADX first, a chart reader can avoid being whipsawed by every little wiggle in a flat market. The common workflow is: “Is ADX high enough to say a trend exists? If yes, use trend tools and respect the +DI/−DI direction. If no, treat the market as a range.” It pairs naturally with direction tools like moving averages, which tell you the way the trend points once ADX confirms a trend is present.
The honest catch
ADX has real limits. First, it lags: it is built from smoothed, averaged data, so it confirms strength after a move is already underway — never before. By the time ADX climbs above 25, a good part of the move may have happened. Second, ADX can be high while price reverses: a strong down-move also produces a high ADX, so a big number is not automatically “good.” Always read it alongside direction. Third, the threshold levels (20, 25, 40) are conventions, not guarantees; they behave differently across instruments and timeframes. And like every indicator, ADX is derived purely from past prices — it describes what has happened, not what will.
Want to see how trend-strength conditions play out across real, recent sessions rather than tidy textbook examples? TrueTrend turns raw market structure into clear, honest analytics. Explore the public TrueTrend scoreboard or start free to learn by observing.
Key takeaways
- ADX (Average Directional Index) runs from 0 to 100 and measures trend strength, not direction.
- Direction comes from +DI versus −DI: +DI above −DI means an upward bias, and the reverse for downward.
- As a rough guide, below ~20–25 is weak or ranging; above 25 is a real trend; above 40 is a strong one.
- ADX works best as a filter — use trend tools only when it confirms a trend exists.
- It lags, a high reading can accompany a sharp fall, and the thresholds are conventions, not rules.
- This is educational content with illustrative numbers only — not trading advice.
See these concepts on live market data — free
Create a free TrueTrend account to watch daily support/resistance levels, market regime, and option-positioning charts on NIFTY, BankNifty and 12 more instruments. Every level we publish is scored on a public scoreboard — misses included. No card required.
Free forever tier · daily levels with published hit-rates across every instrument. Descriptive market structure, not investment advice.
Not ready for an account? Get the daily levels by email.
One short email each market day — the indices' call wall, put wall, gamma flip and max pain, and how the last session's levels scored. Free, no account, unsubscribe anytime.
Descriptive market structure, not investment advice. We never share your email.