ATR Explained: Measuring Market Volatility
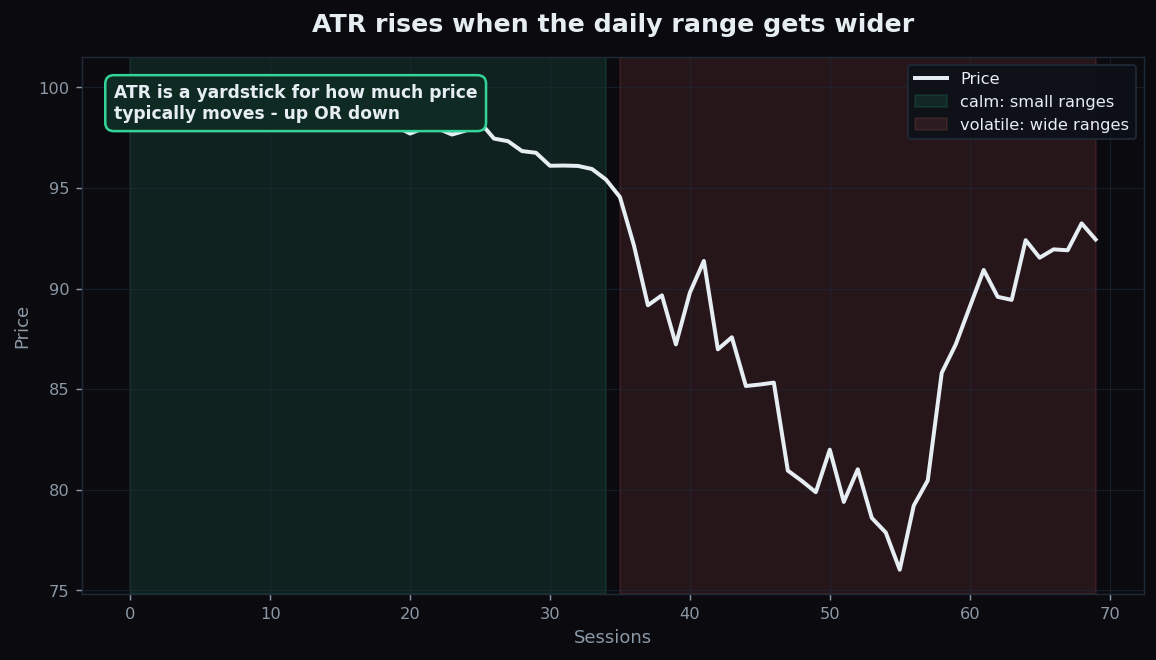
Two stocks can both rise 1% in a day, yet one crawled there in calm steps while the other lurched up and down like a roller-coaster. Price change alone misses that difference. The Average True Range (ATR) is built to capture it — a clean yardstick for how much a market typically moves, regardless of direction. Created by J. Welles Wilder in 1978, it remains one of the most quietly useful tools in technical analysis. This guide explains what it measures, how it is built, and where it stops being helpful.
All figures below are simple, made-up round numbers, used only to teach the mechanics. This is an explanation of a volatility measure, not advice about what to do with it.
What ATR is — and what it is not
ATR is a volatility indicator. Volatility just means how much price jumps around. ATR puts a number on the size of a market’s typical move over a period — say, “this stock tends to travel about ₹15 per day.” It says nothing about direction. A high ATR does not mean “going up” or “going down” — only “moving a lot.” A low ATR means “moving a little.”
Think of ATR as a speedometer, not a compass. A speedometer reading of 80 km/h tells you how fast the car is going, not whether it is heading north or south. ATR is the market’s speedometer for range — busy or sleepy, nothing more.
The building block: True Range
Before averaging anything, Wilder defined a single-period measure called the True Range (TR). A naive way to size a day’s move is simply high minus low. But that ignores gaps — when a stock opens far from where it closed the day before, often after overnight news. To capture gaps, True Range takes the largest of three distances:
- Today’s high minus today’s low (the normal intraday range).
- Today’s high minus yesterday’s close (an up-gap).
- Yesterday’s close minus today’s low (a down-gap).
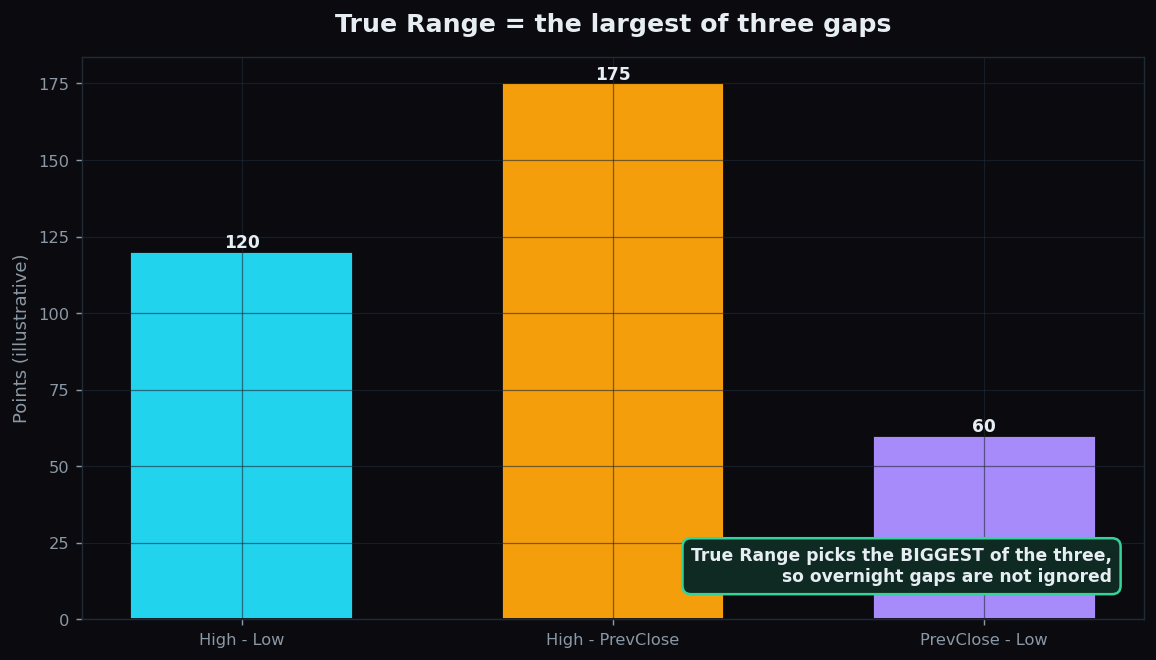
By always picking the biggest of the three, True Range refuses to undercount a day that gapped. If a stock closed at ₹100 yesterday and opened sharply higher today, the real move that traders lived through includes that overnight jump — and True Range counts it.
From True Range to ATR — a worked example
The Average True Range is, as the name says, an average of True Range over a window — Wilder used 14 periods. Averaging smooths out one freakish day so you see the typical range rather than the latest spike.
Let’s build a tiny example. Suppose over five days the True Range values are ₹12, ₹14, ₹10, ₹20, ₹14. A simple average is (12 + 14 + 10 + 20 + 14) ÷ 5 = 70 ÷ 5 = ₹14. So this market’s ATR is about ₹14 — it typically travels roughly fourteen rupees of range per day. If tomorrow’s True Range comes in at ₹30, the ATR ticks up; if the market goes quiet and ranges shrink to ₹6, the ATR drifts down. (Wilder actually used a smoothed running average rather than a plain one, but the idea is identical: a rolling sense of the usual move.)
Why ATR matters
The big benefit is context for size. The same ₹10 move means completely different things in different markets:
- For a stock with an ATR of ₹5, a ₹10 move is twice its typical daily range — a genuinely big day.
- For a stock with an ATR of ₹50, a ₹10 move is noise — barely a fifth of a normal day.
ATR turns raw rupees into a relative scale, so you can compare a calm large-cap with a jumpy small-cap on equal footing. It also adapts automatically: as a market heats up or cools off, ATR rises and falls with it, without you re-tuning anything.
One common illustrative use is sizing how far apart to place a stop — the exit level a trader decides in advance to cap a loss. If a stock’s ATR is ₹15, putting a stop only ₹3 away sits well inside the everyday wiggle, so normal noise would likely trigger it. A stop placed at, say, one-and-a-half times ATR (₹22.5) sits outside the typical daily range. This is an example of the reasoning, not a recommendation: ATR informs how wide “normal” is, and the trader decides what to do with that.
The honest catch: limits of ATR
ATR is genuinely useful, but it is narrow and backward-looking:
- No direction at all. ATR cannot tell you whether a big-range market is rising or falling. It must be paired with trend tools like moving averages to add direction.
- It is a lagging average. Because it averages past ranges, ATR reacts after volatility changes. A sudden shock shows up only as it feeds into the window.
- It is an absolute number, not a percentage. An ATR of ₹50 looks huge next to an ATR of ₹5, but on a ₹5,000 stock that is just 1% — modest. Always read ATR relative to the price level.
- Settings are conventions. The 14-period default is Wilder’s choice, not a law. Shorter windows react faster but jitter more; longer windows are smoother but slower.
Used for what it is — a measure of typical movement — ATR quietly improves almost every other analysis by answering “is this move big or small for this market?” Used as a standalone signal of where price is headed, it cannot help, because direction was never what it measured.
Want to see how volatility shifts across real instruments, session after session, with the outcomes tracked in the open? TrueTrend keeps a transparent, honestly-scored record of its market readings over time — explore the TrueTrend scoreboard or create a free account to follow along.
Key takeaways
- ATR (Average True Range) measures how much a market typically moves — a volatility yardstick, with no view on direction.
- True Range is the largest of three gaps (high−low, high−previous close, previous close−low), so overnight gaps are never undercounted.
- ATR averages True Range over a window (Wilder used 14 periods) to show the usual move rather than a one-off spike.
- It gives context for size: the same rupee move is huge for a low-ATR market and trivial for a high-ATR one — useful, for example, for illustrating how wide a stop distance is.
- ATR has no direction, lags because it is an average, and is an absolute number — always read it relative to the price level and pair it with a trend tool.
See these concepts on live market data — free
Create a free TrueTrend account to watch daily support/resistance levels, market regime, and option-positioning charts on NIFTY, BankNifty and 12 more instruments. Every level we publish is scored on a public scoreboard — misses included. No card required.
Free forever tier · daily levels with published hit-rates across every instrument. Descriptive market structure, not investment advice.
Not ready for an account? Get the daily levels by email.
One short email each market day — the indices' call wall, put wall, gamma flip and max pain, and how the last session's levels scored. Free, no account, unsubscribe anytime.
Descriptive market structure, not investment advice. We never share your email.