Bid, Ask and the Spread Explained Simply
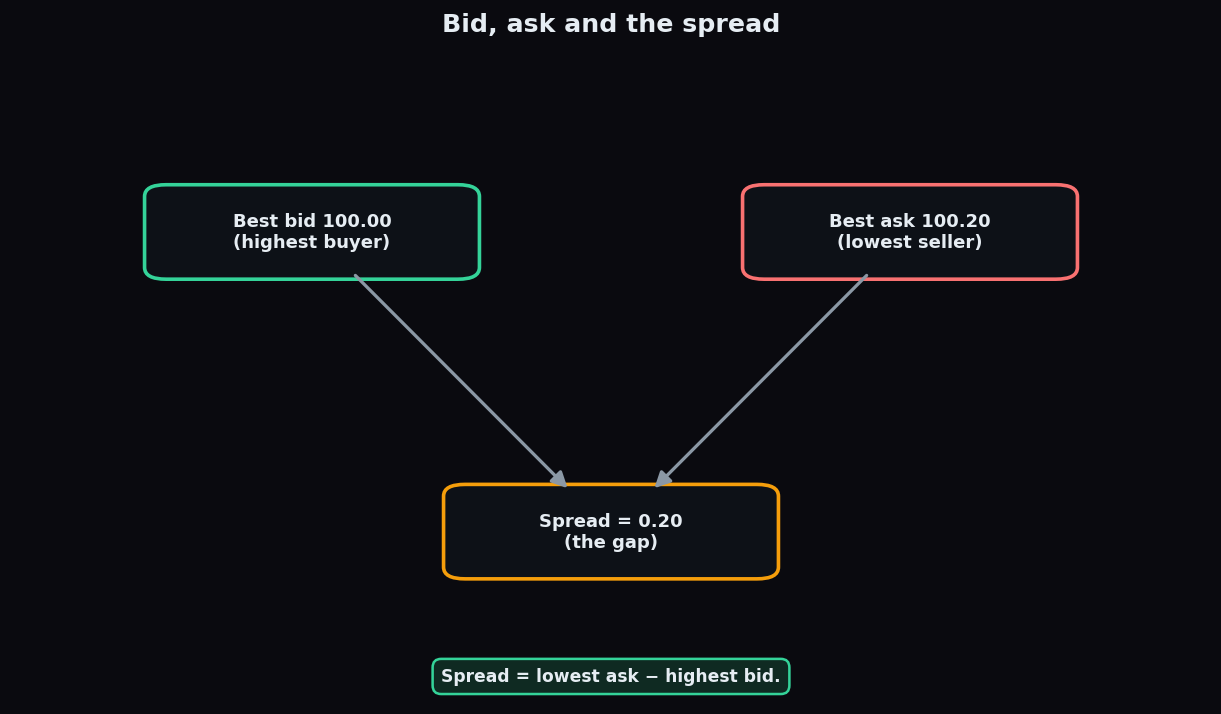
Look closely at any live share quote and you will notice it is not one price but two: a slightly lower number and a slightly higher one, sitting side by side. Those two numbers are the bid and the ask, and the small gap between them — the spread — is one of the most important and most overlooked costs in trading. Understand it, and you understand why your fill price is rarely the exact number you saw on screen.
Bid and ask: the two living prices
At any instant, a share has two prices that matter:
- The bid is the highest price a buyer is currently willing to pay for the share.
- The ask (also called the offer) is the lowest price a seller is currently willing to accept.
Notice the asymmetry that runs the whole market: buyers want to pay as little as possible, sellers want to receive as much as possible. So the best bid always sits a little below the best ask. If they ever meet, a trade happens instantly and both orders disappear from the book.
Here is the everyday analogy. Picture a currency exchange counter at the airport. It will buy your dollars at one rate and sell them back to you at a slightly higher rate. You can do both in the same minute and still come out a little behind. That difference is the counter's margin — and in the share market that exact same gap is the spread.
The spread is the gap — and the cost
The spread is simply the ask minus the bid. If the best bid is 100.00 and the best ask is 100.20, the spread is 0.20. That number is small, but it is a real cost, and here is why.
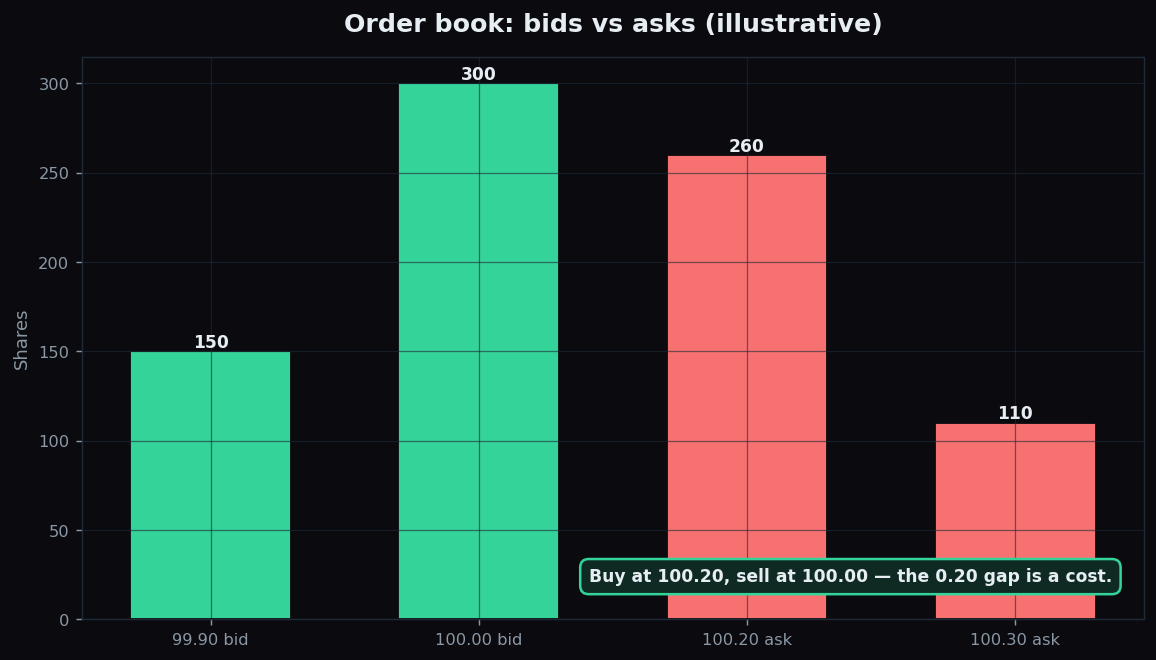
Suppose you want in and out of a share quickly. To buy right now, you must pay the ask of 100.20. If you changed your mind a second later and sold right now, you would receive the bid of 100.00. You did nothing wrong and the market did not move — yet you are down 0.20 per share. That round-trip loss is the spread, and you pay it on top of brokerage and taxes.
A quick worked example
Imagine you become part-owner of 100 shares by buying at the ask of 100.20, spending 10,020. The price has not changed at all, but if you immediately sold back at the bid of 100.00, you would get 10,000. The 20 difference (0.20 × 100 shares) vanished into the spread. For the trade to break even, the price has to climb by at least the spread before you even start thinking about profit. On a liquid, big-name stock this gap is tiny. On a sleepy one it can be painfully wide.
Why the spread widens: it is about liquidity
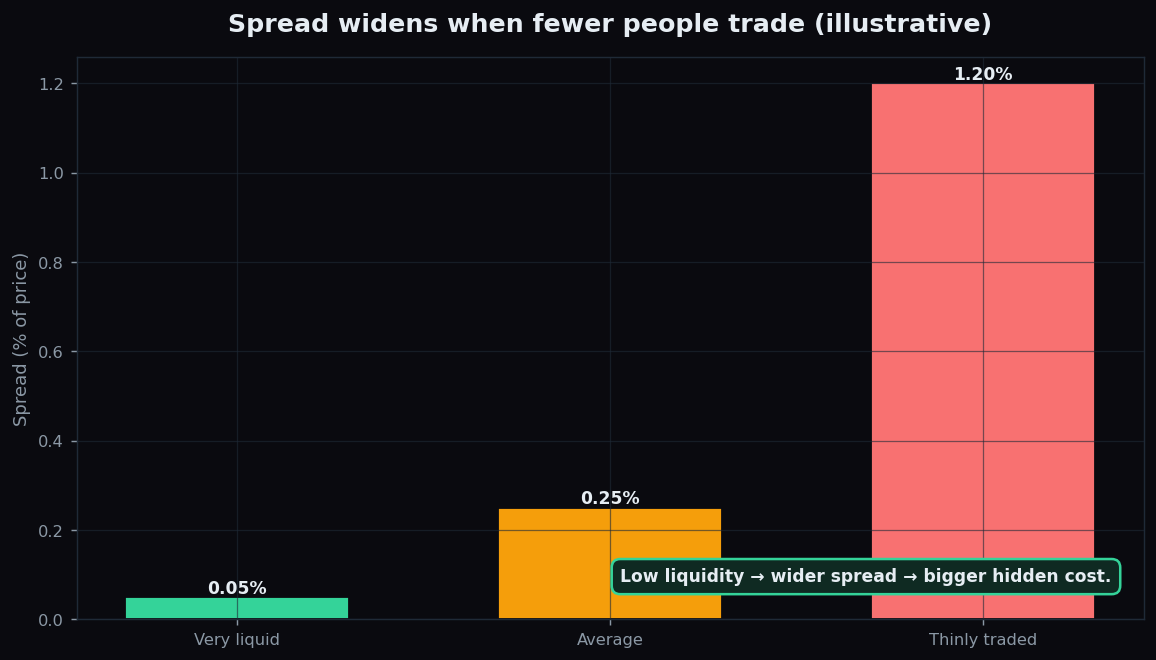
Liquidity means how easily you can buy or sell something without moving its price — in plain terms, how many willing buyers and sellers are crowding around at any moment. Liquidity is the single biggest driver of how wide or narrow a spread is.
- In a highly liquid share — a large, heavily traded company — there are so many bids and asks stacked at nearly every price that the best bid and best ask are almost touching. The spread is razor-thin.
- In a thinly traded share — a small company few people follow — buyers and sellers are scarce. The nearest willing buyer and the nearest willing seller may be far apart, so the spread yawns open.
Spreads also widen at certain times, not just for certain stocks. Just after the market opens, around major news, or in the last frantic minutes before close, uncertainty rises and market makers pull back — so even a normally tight spread can briefly balloon.
The honest catch
The spread is a quiet cost that beginners routinely forget. A few things worth keeping front of mind:
- The quoted price is not your fill price. You generally buy at the ask and sell at the bid, not at the single “last traded” number you see on a headline ticker.
- Frequent trading multiplies the cost. Pay the spread once and it is small. Pay it on dozens of in-and-out trades a day and it adds up fast.
- Thin stocks hide a fat cost. A low-volume share can look cheap to trade until the wide spread quietly eats your return.
- A wide spread is also a warning. It signals few participants, which means your own order can move the price more than you expect.
One practical defence is understanding order types — our explainer on market orders versus limit orders shows how a limit order lets you avoid paying the full spread by naming your own price.
Hidden costs like the spread are exactly the kind of market mechanics that separate informed participants from the rest. TrueTrend breaks down this plumbing in clear, beginner-friendly explainers and transparent dashboards, so you can see the real cost of a trade before you ever place one. Start free and learn the machine.
Key takeaways
- The bid is the highest price a buyer will pay; the ask is the lowest price a seller will accept.
- The spread is ask minus bid — a real, built-in cost you pay every round trip.
- Buying 100 shares at a 100.20 ask and selling at a 100.00 bid loses 20 to the spread, before brokerage or taxes.
- Spreads are narrow when liquidity is high and wide when it is low, and they balloon around the open, close, and big news.
- The screen price is not your fill price — a wide spread is both a hidden cost and a warning sign.
See these concepts on live market data — free
Create a free TrueTrend account to watch daily support/resistance levels, market regime, and option-positioning charts on NIFTY, BankNifty and 12 more instruments. Every level we publish is scored on a public scoreboard — misses included. No card required.
Free forever tier · daily levels with published hit-rates across every instrument. Descriptive market structure, not investment advice.
Not ready for an account? Get the daily levels by email.
One short email each market day — the indices' call wall, put wall, gamma flip and max pain, and how the last session's levels scored. Free, no account, unsubscribe anytime.
Descriptive market structure, not investment advice. We never share your email.