Bull Market vs Bear Market: What They Really Mean
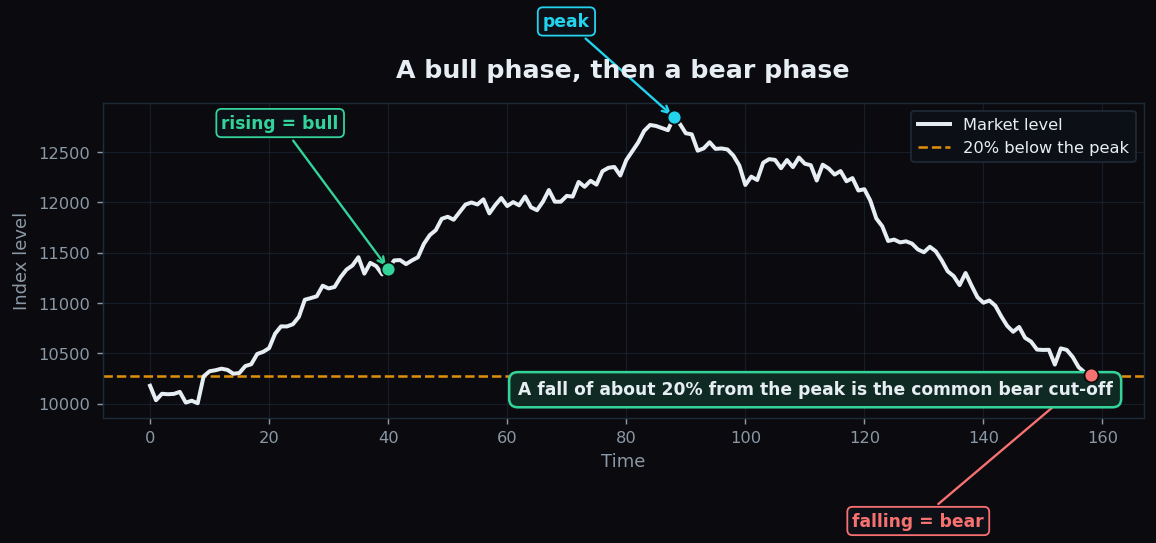
You have heard markets described as a bull market or a bear market. These two animals are the most common shorthand in finance, and they describe the broad direction and mood of prices over a stretch of time. This post defines both clearly, explains the rough “20% rule” people use to tell them apart, and looks at the crowd psychology that drives each one.
What the two terms mean
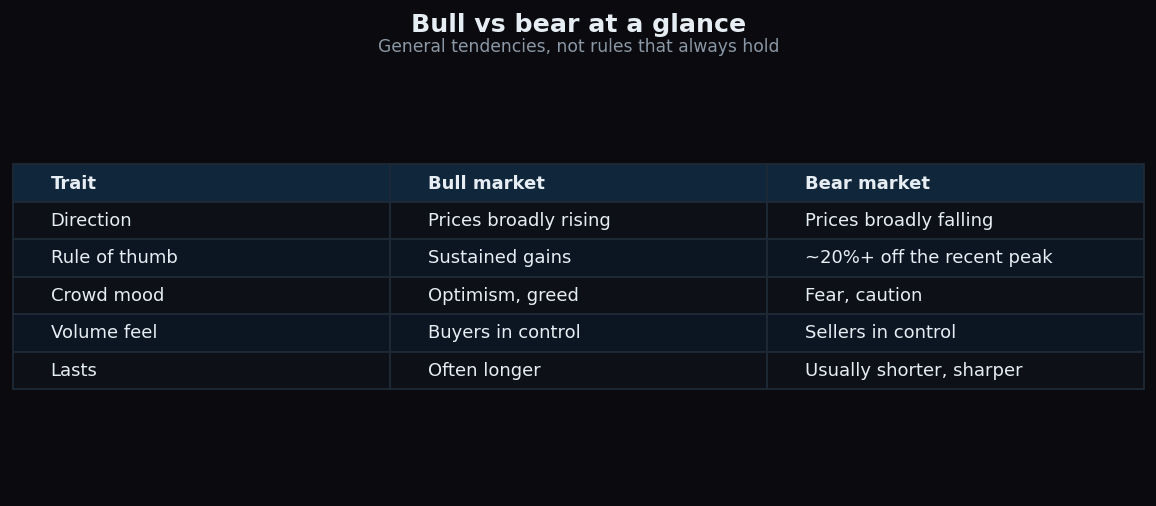
A bull market is a long stretch where prices are broadly rising and optimism is high. A bear market is a long stretch where prices are broadly falling and caution or fear takes over. The labels are usually applied to a whole market or index, not to a single share moving for a day.
Why a bull and a bear? The popular memory aid is how each animal attacks: a bull thrusts its horns upward (prices pushed up), while a bear swipes its paws downward (prices knocked down). It is just a picture to make the direction stick.
The 20% rule of thumb
How far does a market have to fall before people call it a bear market? There is no law, but a widely used rule of thumb is a drop of about 20% or more from a recent peak, sustained rather than a one-day blip. A bull market is the mirror image: a sustained recovery and rise, often dated from the low point after a bear phase.
Two smaller terms help fill the gap:
- A correction is a more modest pullback, often quoted as roughly a 10% fall from the peak — uncomfortable but milder than a bear market.
- A rally is a sharp rise that can happen even inside a bear market (a “bear-market rally”), which is why a few green days do not by themselves end a downtrend.
A worked example with round numbers
Suppose an index peaks at a tidy 20,000 points (all numbers invented for teaching). To work out the 20% threshold, take 20% of 20,000, which is 4,000. Subtract it: 20,000 − 4,000 = 16,000.
So if the index slides from 20,000 down to 16,000 and stays around there, that roughly 20% fall is what many would start calling a bear market. If instead it only dipped to 18,000, that is a 10% fall — a correction, not yet a bear market. And if months later it climbs from 16,000 back up past 19,000 and keeps making higher highs, observers would say a new bull phase is under way. The exact numbers are never magic; they are a shared vocabulary for “how big and how sustained” the move is.
Why the labels matter: crowd psychology
Markets are made of people, and the two phases come with very different moods. That mood is half the story.
- In a bull market, rising prices feed optimism. Confidence grows, more buyers step in, and that buying can push prices higher still — a self-reinforcing loop. Late in a bull run this can tip into greed, where caution gets forgotten.
- In a bear market, falling prices feed fear. Worry spreads, sellers rush for the exit, and that selling can drive prices down further. Late in a bear phase this can tip into capitulation, where even patient holders give up.
Understanding the mood matters because emotions tend to peak exactly when they are least reliable. The loudest optimism often clusters near tops and the deepest gloom near bottoms. Naming the regime is a reminder to separate the mood from the facts.
How the idea is used
People use these labels mainly to set context, not to predict the next tick:
- Framing risk. Knowing whether the broad trend is up or down shapes how cautiously someone reads day-to-day news.
- Comparing periods. Saying “this happened during the bear market” instantly tells others the backdrop.
- Checking emotions. Recognising a greedy or fearful crowd is a prompt to slow down and think, rather than follow the herd.
The honest catch
The bull/bear frame is useful but rough. Respect its limits:
- It is named in hindsight. You can usually only be sure a bull or bear market happened after the peak or trough is well behind you. In the moment, it is murky.
- The 20% line is arbitrary. A 19% fall and a 21% fall feel almost identical; the threshold is a convention, not a switch that flips behaviour.
- Phases are not clean. Bull markets have scary dips and bear markets have sharp rallies, so any single move can mislead.
- The label is not a forecast. Calling something a bull market describes the past and present, not a promise about tomorrow.
For a sense of how trend direction is gauged in the first place, the companion piece on how moving averages smooth price is a natural next read.
Curious how a market’s broad direction looks when it is measured rather than guessed? TrueTrend presents market context in plain language for learners — you can start for free and explore.
Key takeaways
- A bull market is a sustained broad rise with optimism; a bear market is a sustained broad fall with fear.
- A common rule of thumb marks a bear market at roughly 20% or more below a recent peak; a ~10% dip is usually called a correction.
- Each phase carries its own crowd psychology, and those emotions are least reliable exactly when they are strongest.
- The labels are named largely in hindsight, the 20% line is a convention, and neither tag predicts the future.
See these concepts on live market data — free
Create a free TrueTrend account to watch daily support/resistance levels, market regime, and option-positioning charts on NIFTY, BankNifty and 12 more instruments. Every level we publish is scored on a public scoreboard — misses included. No card required.
Free forever tier · daily levels with published hit-rates across every instrument. Descriptive market structure, not investment advice.
Not ready for an account? Get the daily levels by email.
One short email each market day — the indices' call wall, put wall, gamma flip and max pain, and how the last session's levels scored. Free, no account, unsubscribe anytime.
Descriptive market structure, not investment advice. We never share your email.