The Cash Flow Statement Explained for Beginners
There is an old warning in finance: profit is an opinion, but cash is a fact. A company can report glowing profits and still run out of money — and when it does, it dies. The cash flow statement is the report that cuts through the accounting and shows the one thing that cannot be faked: how much actual cash moved in and out of the business, and where it went.
This is often the most trusted of the three financial statements precisely because cash is so literal. You either have it or you do not. Let's unpack how the statement is built and why its number can differ so sharply from reported profit.
Why cash and profit are different
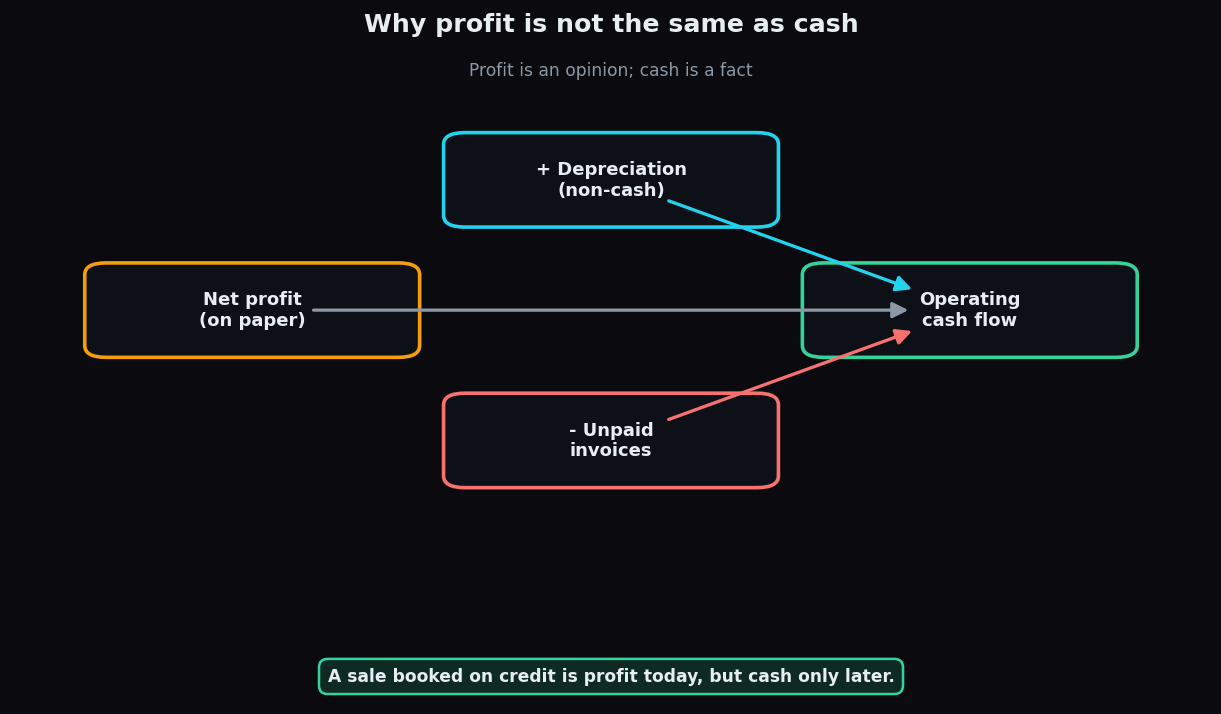
The gap surprises beginners, so start here. On the income statement, a sale is counted as profit the moment it happens — even if the customer pays three months later. Meanwhile, some costs on paper (like depreciation, the gradual writing-down of a machine's value) never involve cash leaving the bank at all.
So profit and cash drift apart. Imagine you run a furniture shop and sell a Rs 1 lakh sofa on credit in March. Your income statement shows Rs 1 lakh of revenue and a healthy profit in March — but not a single rupee has reached your bank. If your rent is due and the customer pays in June, you can be "profitable" and still unable to pay the landlord. Cash flow is the report that would have warned you.
The three sections: three taps into one tank
The cash flow statement sorts every rupee of cash movement into three buckets. Picture a water tank with three taps feeding it and draining it.
- Operating cash flow (CFO) — cash from the core business: money received from customers, minus cash paid to suppliers and staff. This is the most important line. A healthy company generates real cash from simply doing what it does. If this tap runs dry while profits look fine, be curious.
- Investing cash flow (CFI) — cash spent on or received from long-term assets: buying machinery or property (cash out), or selling them (cash in). Steady negative investing cash flow is often healthy — it means the company is reinvesting to grow.
- Financing cash flow (CFF) — cash exchanged with lenders and owners: raising a loan or issuing shares (cash in), repaying debt or paying dividends (cash out).
Add the three together and you get the net change in cash for the period. Start with the cash you had at the beginning, apply that change, and you land on the cash you have at the end — a figure you can literally check against the bank balance.
A worked example with round numbers
Take a fictional firm, GreenGrow Ltd, over one year:
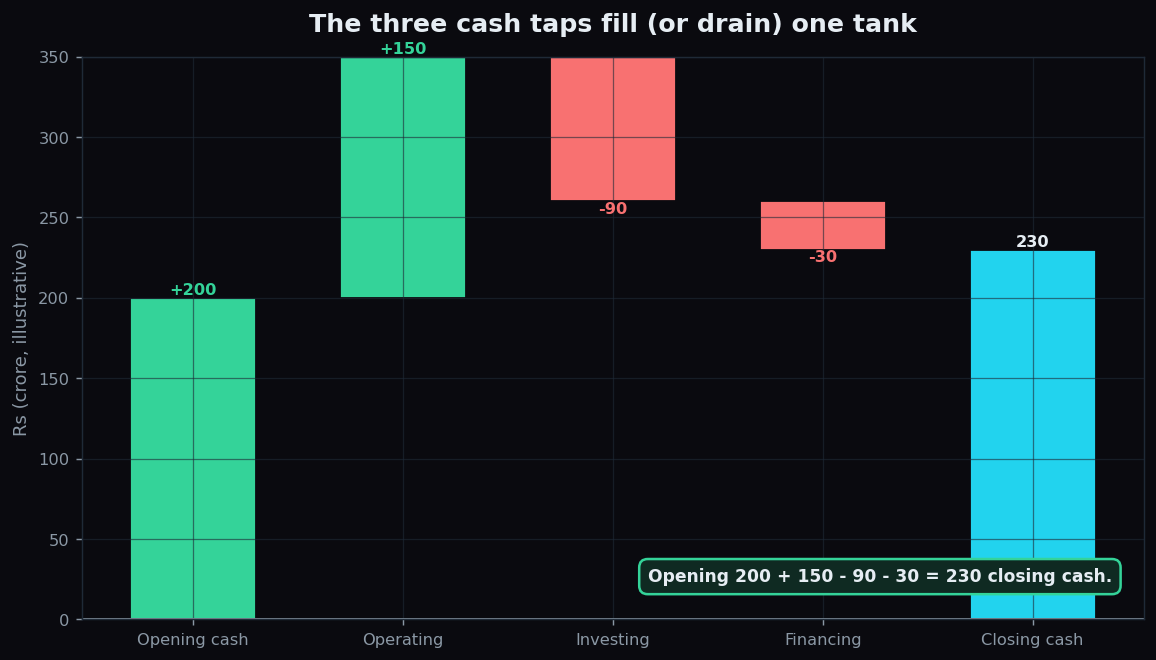
- Opening cash: Rs 200 crore
- Operating cash flow: +Rs 150 crore (the business threw off real cash)
- Investing cash flow: −Rs 90 crore (bought new machinery to expand)
- Financing cash flow: −Rs 30 crore (repaid part of a loan)
- Closing cash: 200 + 150 − 90 − 30 = Rs 230 crore
Read the shape, not just the total. GreenGrow made Rs 150 crore of genuine operating cash, spent most of it on growth, repaid some debt, and still ended the year with more cash than it started. That is a comfortable, self-funding pattern. Contrast it with a company whose operating cash is negative and whose only positive tap is financing — that firm is staying alive by borrowing, which cannot continue forever. The three signs together tell a story that a single profit figure never could.
The honest catch
Cash flow is the hardest statement to fake, but it is not magic.
- Timing can flatter a single period. A company can delay paying suppliers or lean on customers to pay early, pumping up operating cash flow for one quarter. Look at the trend across several periods, not one snapshot.
- Negative cash flow is not automatically bad. A young, fast-growing company may burn cash for years while it builds — that can be healthy or reckless depending on what the cash is buying.
- It does not tell you about profitability or value on its own. A firm can generate cash by selling off its best assets — great for this year's cash line, terrible for the future.
The cash flow statement is best read as the reality check on the other two reports: the income statement claims a profit, the balance sheet shows the position, and cash flow confirms whether the money is genuinely there.
Following the cash is one of the most useful habits an investor can build. TrueTrend is an analytics and education platform that lays out market data in plain language so you can learn to read it for yourself — start free.
Key takeaways
- The cash flow statement tracks real cash in and out, which can differ sharply from reported profit.
- Profit and cash diverge because sales are booked before payment and some costs (like depreciation) involve no cash.
- It has three sections: operating, investing and financing cash flows, which sum to the change in cash.
- Operating cash flow is the headline health check — a strong business generates cash from its core activity.
- Judge the pattern across periods; a single quarter can be flattered by timing.
See these concepts on live market data — free
Create a free TrueTrend account to watch daily support/resistance levels, market regime, and option-positioning charts on NIFTY, BankNifty and 12 more instruments. Every level we publish is scored on a public scoreboard — misses included. No card required.
Free forever tier · daily levels with published hit-rates across every instrument. Descriptive market structure, not investment advice.
Not ready for an account? Get the daily levels by email.
One short email each market day — the indices' call wall, put wall, gamma flip and max pain, and how the last session's levels scored. Free, no account, unsubscribe anytime.
Descriptive market structure, not investment advice. We never share your email.