The Income Statement Explained: Revenue to Net Profit
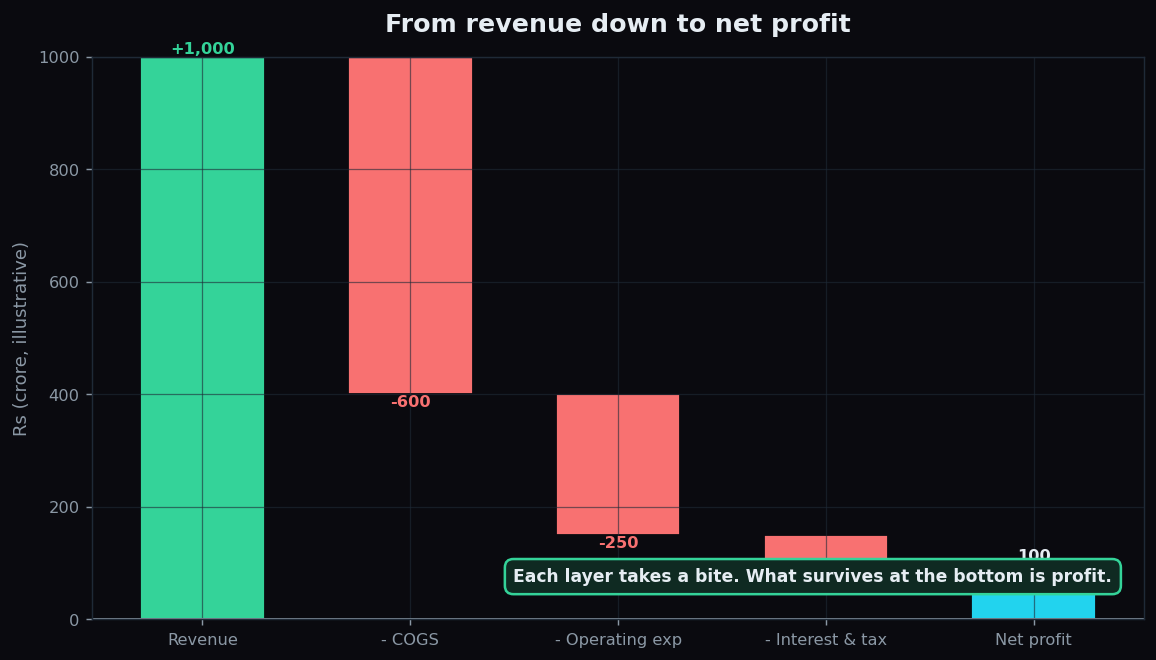
If the balance sheet is a photograph of a company on one day, the income statement is the movie of what happened over a whole period — a quarter or a year. It answers the question everyone actually cares about: did the business make money, and how much survived the journey from sales to profit? This guide walks that journey from the top line to the bottom line, one honest layer at a time.
The income statement is also called the profit and loss statement, or simply the "P&L". Whatever the name, it is a subtraction story: you start with all the money that came in, then peel off cost after cost until you reach what is left.
Starting at the top: revenue
The first line is revenue (also called sales or the "top line"). It is the total value of goods or services the company sold in the period — before a single cost is taken out. Revenue answers "how much business did we do?", not "how much did we keep?".
Picture a lemonade stall. If you sold 1,000 glasses at Rs 10 each, your revenue is Rs 10,000. That number feels great — but you have not yet paid for lemons, sugar, cups or your helper. The whole point of the income statement is to march down from that cheerful top number to the sober one at the bottom.
The layers of cost (and the profit at each stage)
Costs come off in a deliberate order, and each stage reveals a different kind of profit. Understanding the layers is the whole skill.
- Cost of goods sold (COGS) — the direct cost of making what you sold: the lemons and sugar and cups. Revenue minus COGS gives gross profit, which shows how profitable the core product is before running-the-business costs.
- Operating expenses — the cost of running the whole operation regardless of any single sale: salaries, rent, marketing, admin. Gross profit minus operating expenses gives operating profit (often called EBIT), the profit from the actual business before financing and tax.
- Interest and tax — the cost of borrowed money and the government's share. Take these off operating profit and you finally reach net profit, the "bottom line" — the money that truly belongs to the owners.
So there is not one profit but several, stacked like floors: gross, operating, and net. A company can look strong on one floor and weak on another, and knowing which floor is leaking is where real insight lives.
Margins: profit as a percentage
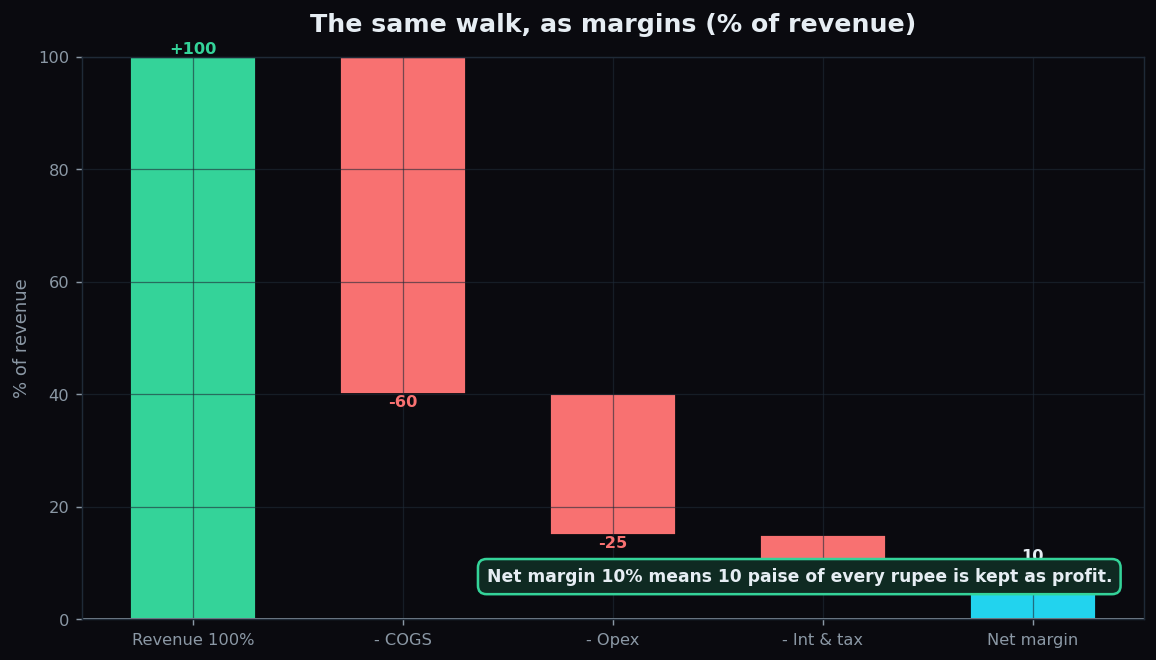
Raw rupees are hard to compare across companies of different sizes, so analysts convert each profit layer into a margin — profit as a percentage of revenue. Margins let you compare a corner shop with a giant on equal terms, and track whether a business is getting more or less efficient over time.
- Gross margin = gross profit ÷ revenue
- Operating margin = operating profit ÷ revenue
- Net margin = net profit ÷ revenue
A worked example with round numbers
Take a fictional company, Crisp Snacks Ltd, for one year:
- Revenue: Rs 1,000 crore
- Less COGS Rs 600 crore → Gross profit Rs 400 crore (gross margin 40%)
- Less operating expenses Rs 250 crore → Operating profit Rs 150 crore (operating margin 15%)
- Less interest and tax Rs 50 crore → Net profit Rs 100 crore (net margin 10%)
Read it as a sentence: for every Rs 100 of sales, Crisp Snacks keeps Rs 40 after making the product, Rs 15 after running the company, and Rs 10 once the bank and the taxman are paid. That final 10% net margin means ten paise of every rupee of sales ends up as genuine profit. Whether that is good depends entirely on the industry — a supermarket living on 3% and a software firm on 25% can both be perfectly healthy.
The honest catch
The income statement is essential, but it can flatter and it can mislead.
- Profit is not cash. A sale counts as revenue the moment it is made, even if the customer has not paid yet. A company can report a rising profit while its bank balance quietly shrinks — which is exactly why the balance sheet and the cash flow statement exist.
- One-off items distort the bottom line. Selling a building or taking a legal charge can swell or crush net profit in a way that says nothing about the ongoing business. Analysts often look at operating profit to sidestep this.
- Accounting choices bend the numbers. How fast a company depreciates equipment or recognises revenue is a judgement call, and different choices produce different profits from identical facts.
Treat the income statement as one witness, not the whole jury. Its layers tell you where a business makes or loses money; the other two statements tell you whether that money is real and whether the company can survive.
Reading a P&L line by line is a habit that pays off for a lifetime. TrueTrend is an analytics and education platform that presents market data in plain language so you can learn to interpret it yourself — start free.
Key takeaways
- The income statement (P&L) walks from revenue at the top down to net profit at the bottom.
- Costs peel off in layers, revealing gross, operating and net profit — each a different view of profitability.
- Margins express each profit as a percentage of revenue, making companies of different sizes comparable.
- "Good" margins are entirely industry-dependent; compare like with like.
- Profit is not cash and can be distorted by one-offs, so read the P&L alongside the other two statements.
See these concepts on live market data — free
Create a free TrueTrend account to watch daily support/resistance levels, market regime, and option-positioning charts on NIFTY, BankNifty and 12 more instruments. Every level we publish is scored on a public scoreboard — misses included. No card required.
Free forever tier · daily levels with published hit-rates across every instrument. Descriptive market structure, not investment advice.
Not ready for an account? Get the daily levels by email.
One short email each market day — the indices' call wall, put wall, gamma flip and max pain, and how the last session's levels scored. Free, no account, unsubscribe anytime.
Descriptive market structure, not investment advice. We never share your email.