Divergence: When Price and Momentum Disagree
Most of the time, price and momentum move together: when price makes a new high, the momentum indicator beneath it makes a new high too. But every so often they disagree — price pushes to a fresh high while the indicator quietly makes a lower high. That disagreement has a name: divergence. It is one of the most-watched warning signs in technical analysis because it hints that the engine behind a move may be losing power.
What divergence is
A momentum oscillator is an indicator that measures the speed of a price move rather than its level. The most common is the RSI (Relative Strength Index), which runs between 0 and 100 and rises when gains are strong, falls when losses dominate. Divergence is simply a mismatch between what price is doing and what that oscillator is doing.
An analogy helps. Picture a car still rolling forward but with your foot easing off the accelerator. The car (price) is still moving ahead, but the engine effort (momentum) is fading. The car keeps going for a while — momentum carries it — but the push behind the motion is weakening. Divergence is the chart's way of showing you that easing foot.
Regular divergence — the exhaustion warning
Regular divergence warns that a trend may be running out of steam. It comes in two flavours:
- Regular bearish divergence: price makes a higher high, but the oscillator makes a lower high. The rally is reaching new ground on weaker momentum.
- Regular bullish divergence: price makes a lower low, but the oscillator makes a higher low. The decline is reaching new lows but the selling pressure is fading.
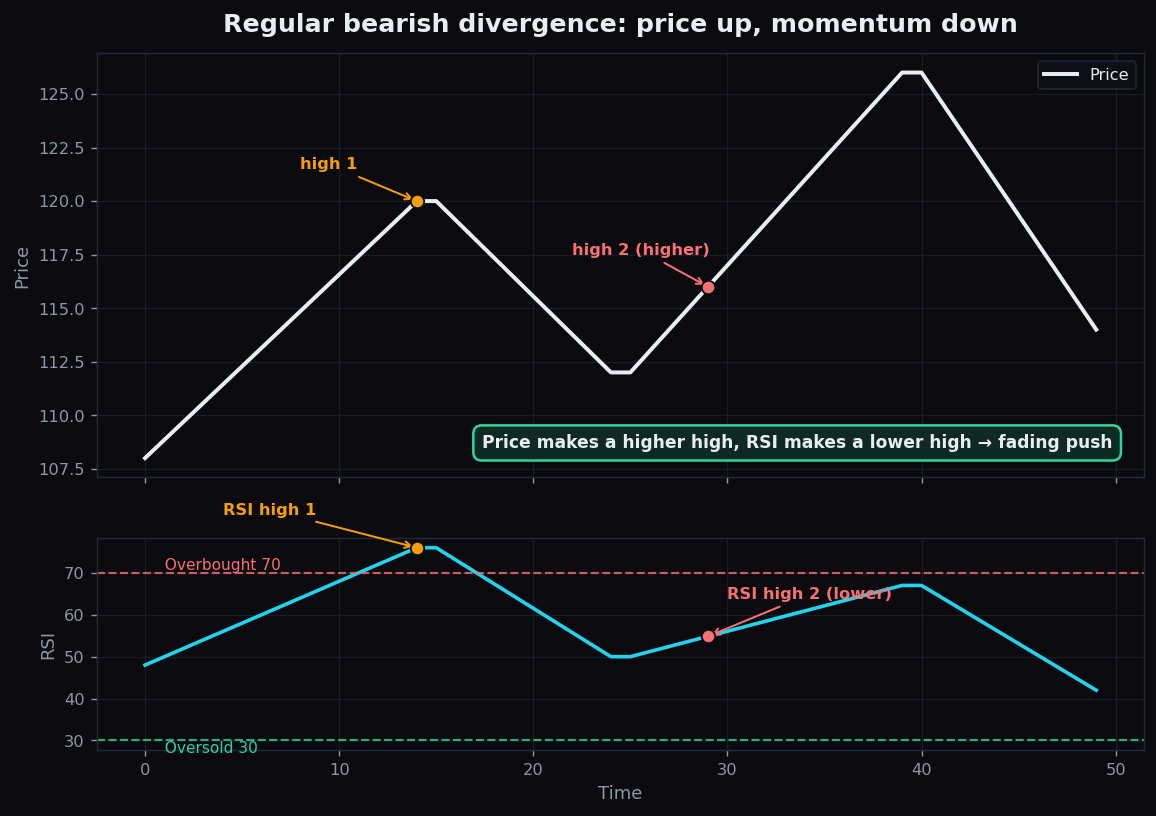
In the chart above, look at the two peaks. On the price panel, the second peak is higher than the first. On the RSI panel directly below, the second peak is lower than the first. Price says "new high," momentum says "less push than last time." That is textbook regular bearish divergence — a hint that the up-move may be tiring.
Hidden divergence — the continuation hint
There is a second, less famous cousin: hidden divergence, which points the opposite way. Instead of warning that a trend is ending, it hints that a trend is likely to continue after a pause. It typically shows up during a pullback inside an ongoing trend:
- Hidden bullish divergence: in an uptrend, price makes a higher low, but the oscillator makes a lower low. The dip looks worse on the oscillator than it really is in price — often read as the uptrend resuming.
- Hidden bearish divergence: in a downtrend, price makes a lower high, but the oscillator makes a higher high — a hint the downtrend may resume.
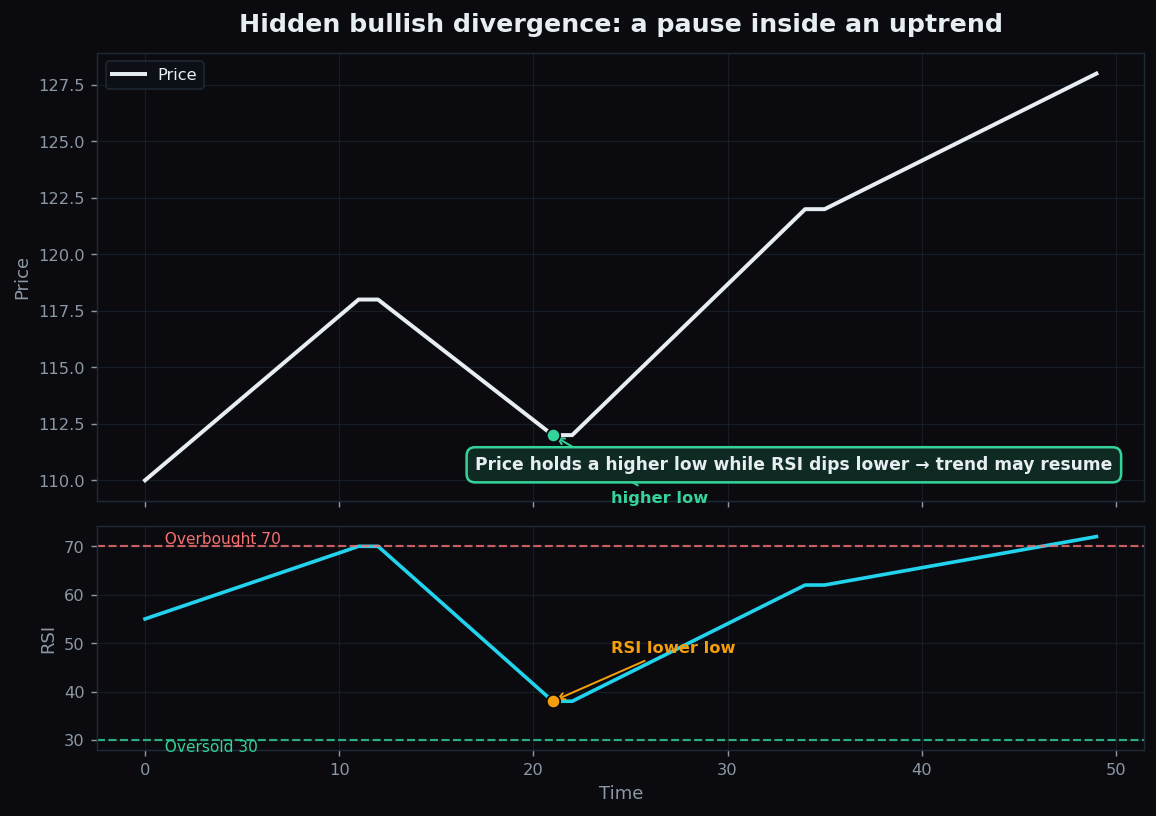
An easy way to keep them straight: regular divergence is a reversal hint (the trend may end), while hidden divergence is a continuation hint (the trend may resume). Regular looks at the price highs in an uptrend; hidden looks at the price lows.
Why it hints at exhaustion
The logic behind regular divergence is intuitive. A trend is powered by a steady supply of fresh participants pushing in one direction. When price grinds to a new high but momentum cannot match its previous peak, it suggests fewer and fewer participants are willing to chase the move. The move is becoming top-heavy. It does not mean a reversal is here — only that the fuel gauge is reading lower than it was. A car coasting can coast a long way.
A worked example with round numbers
Suppose price rallies to a first peak at 120, and at that moment RSI reads 76. Price pulls back, then rallies again to a higher peak at 126 — but this time RSI only reaches 67. Price went up (120 → 126); momentum went down (76 → 67). That gap is the divergence. A trader watching this would not conclude "the top is in"; they would note that the second push was weaker and treat it as one piece of caution to weigh against everything else on the chart. The numbers are illustrative, chosen to make the comparison clear.
The honest catch
- Divergence can persist. Momentum can keep diverging while price keeps trending for a long time. "Weakening" is not "reversing." Acting on the first hint of divergence is a classic way to fight a trend too early.
- It is a hint, not a trigger. Divergence describes a condition; it does not, by itself, say a turn has happened. Many traders wait for separate confirmation before concluding anything.
- It is subjective. Which peaks or troughs you compare changes the picture, so two analysts can see different divergences on the same chart.
- Plenty of divergences fail. Like every signal, it works sometimes and not others — it is context, not a crystal ball.
Used well, divergence is a thoughtful question the chart asks you — is this move as strong as it looks? — not an answer. It pairs naturally with other context such as open interest, which speaks to participation behind a move.
Momentum hints are easier to trust when you can study how they actually played out across many sessions. TrueTrend keeps a transparent, education-first scoreboard so you can examine real market behaviour over time instead of trusting one tidy example — explore it and judge for yourself.
Key takeaways
- Divergence is a disagreement between price and a momentum oscillator such as RSI.
- Regular divergence warns a trend may be tiring (price higher high, RSI lower high — or the bullish mirror).
- Hidden divergence hints a trend may continue after a pause (uptrend: price higher low, RSI lower low).
- It signals fading push, not a guaranteed reversal — divergence can persist for a long time.
- Treat it as a question to weigh with other clues — this article is education, not advice.
See these concepts on live market data — free
Create a free TrueTrend account to watch daily support/resistance levels, market regime, and option-positioning charts on NIFTY, BankNifty and 12 more instruments. Every level we publish is scored on a public scoreboard — misses included. No card required.
Free forever tier · daily levels with published hit-rates across every instrument. Descriptive market structure, not investment advice.
Not ready for an account? Get the daily levels by email.
One short email each market day — the indices' call wall, put wall, gamma flip and max pain, and how the last session's levels scored. Free, no account, unsubscribe anytime.
Descriptive market structure, not investment advice. We never share your email.