The Doji Candlestick: Indecision Explained
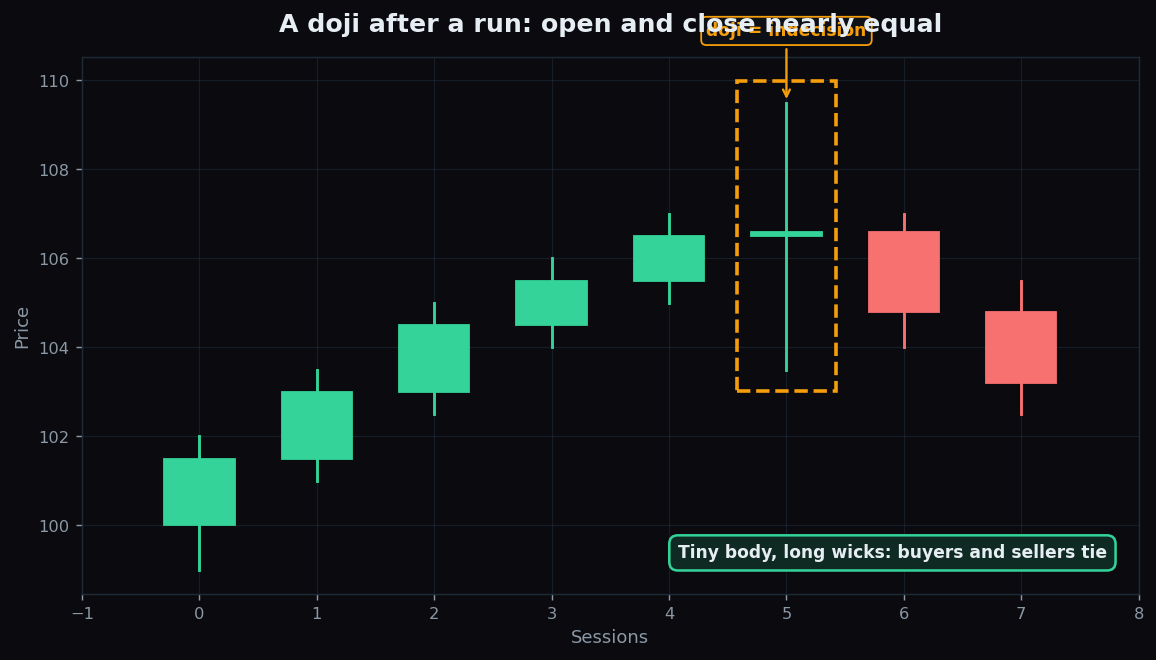
Most candlesticks tell a one-sided story: buyers won the session, or sellers did. The doji tells a different one — a tie. It is the candle of indecision, the moment a market shrugs and says "I am not sure." Learning to read it is a small but genuinely useful skill, as long as you remember that a tie is information, not a forecast.
A quick refresher on the candle
Each candlestick packs four prices into one shape: the open (first trade of the period), the close (last trade), the high, and the low. The thick part is the body (open-to-close), and the thin lines above and below are the wicks or shadows (the extremes price touched).
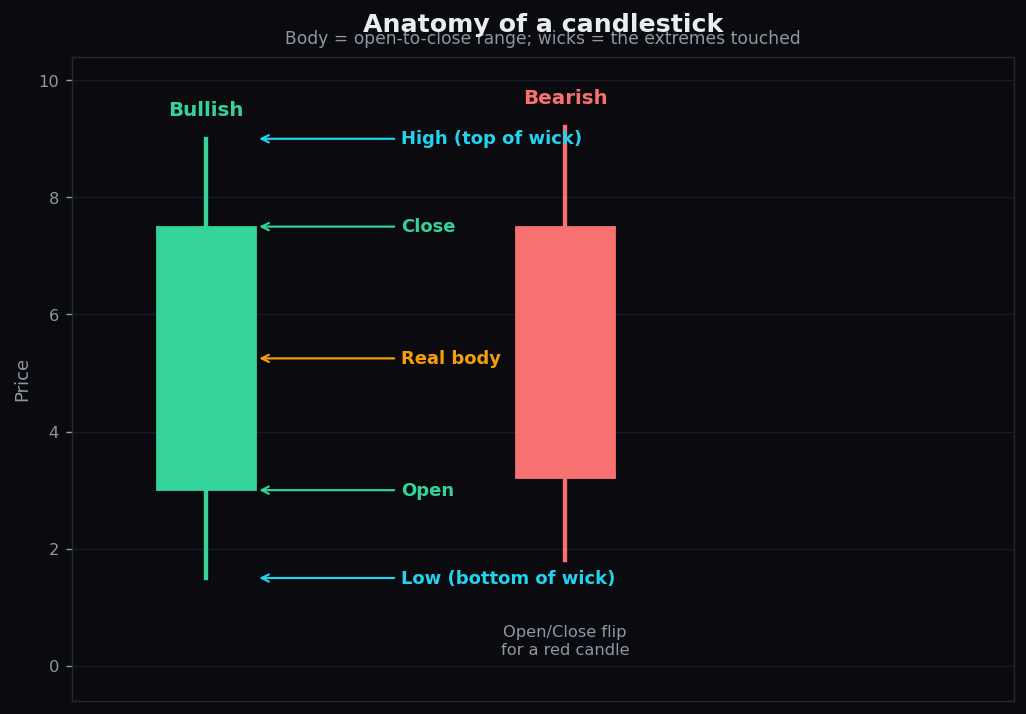
The size of the body is the key. A long body means the open and close were far apart — one side dominated. A tiny body means they finished almost where they started. That tiny body is the heart of the doji.
What a doji is
A doji forms when the open and close are nearly equal, so the body shrinks to little more than a thin horizontal line. Price may have swung widely during the session — long wicks in both directions — but by the close, buyers and sellers ended in a near-perfect standstill. The literal meaning, from the Japanese, is roughly "the same thing": same open, same close.
An analogy: imagine a tug-of-war where both teams heave with everything they have, the rope jerks left and right all afternoon, and at the final whistle the flag is back at the exact centre. Nobody won. That is a doji — effort without resolution.
A worked example with round numbers
Here is an illustrative example. Suppose a stock opens at ₹500, spikes up to ₹512, slides all the way down to ₹489, and then closes at ₹500.5. The open and close differ by just ₹0.50 on a session that ranged ₹23 wide. The body is a sliver; the wicks are long on both sides. That is a textbook doji: lots of fighting, no winner.
The common doji shapes
Not all dojis look the same. The body is always tiny — the wicks are what create the variants:
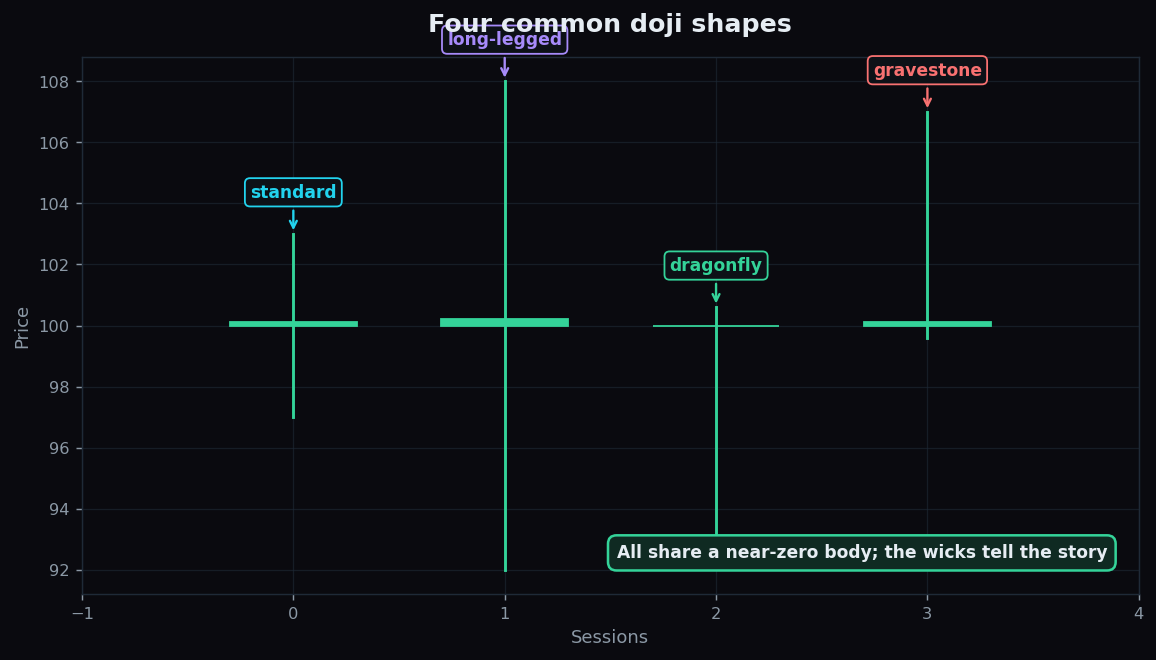
- Standard doji — small wicks above and below; a plain, balanced pause.
- Long-legged doji — long wicks on both sides; a wild, volatile session that still ended flat. Maximum indecision.
- Dragonfly doji — open, close and high cluster at the top with a long lower wick; sellers pushed price down hard but buyers dragged it all the way back.
- Gravestone doji — open, close and low cluster at the bottom with a long upper wick; buyers pushed up but sellers slammed it back down.
Why context is everything
This is the part beginners most often miss: a doji means nothing on its own. Indecision only matters relative to what came before it. The same shape reads completely differently depending on where it appears.
- After a long, confident uptrend, a doji says the buyers who were firmly in control have suddenly lost their grip — the trend's momentum has paused.
- After a steep downtrend, a doji says relentless selling has finally met equal buying — the slide has, at least for now, stalled.
- In the middle of a choppy, sideways range, a doji is barely worth noting — the market was already undecided.
So a doji is best read as a question, not an answer: "the previous force just lost steam — will it resume or reverse?" The candle does not tell you which. The sessions that follow do. To see how a single candle differs from a smoothed view of the whole trend, our moving averages guide is a useful companion.
The honest catch
Dojis are widely watched, which is exactly why they deserve careful reading:
- They are common. Quiet, balanced days happen all the time and mean very little — especially in a range.
- "Nearly equal" is fuzzy. How close must open and close be to count? There is no official rule, so it is partly judgement.
- They signal a pause, not a direction. A doji never tells you which way price goes next — only that the prior push has stalled.
- They need confirmation. On their own they predict nothing; readers wait to see what the next candles do.
Used well, a doji is a clean way to describe a moment of balance after a strong move. Used carelessly, it is just a small candle you have read too much into.
Want candle patterns described with the misses shown alongside the hits, not hyped? TrueTrend keeps an open analytics scoreboard so you can see how chart signals actually behave over time.
Key takeaways
- A doji forms when the open and close are nearly equal, leaving a tiny body — the candle of indecision.
- The body is always small; the wicks create the variants: standard, long-legged, dragonfly and gravestone.
- Context decides its meaning — a doji after a strong trend matters far more than one inside a choppy range.
- It signals a pause, never a direction, and needs the following candles to confirm anything.
- Dojis are common and "nearly equal" is fuzzy — they describe balance, they do not predict the next move.
See these concepts on live market data — free
Create a free TrueTrend account to watch daily support/resistance levels, market regime, and option-positioning charts on NIFTY, BankNifty and 12 more instruments. Every level we publish is scored on a public scoreboard — misses included. No card required.
Free forever tier · daily levels with published hit-rates across every instrument. Descriptive market structure, not investment advice.
Not ready for an account? Get the daily levels by email.
One short email each market day — the indices' call wall, put wall, gamma flip and max pain, and how the last session's levels scored. Free, no account, unsubscribe anytime.
Descriptive market structure, not investment advice. We never share your email.