Double Top and Double Bottom Patterns
Two of the easiest chart shapes to recognise are the double top and the double bottom. One looks like the letter M, the other like a W. Both are reversal patterns, and both rest on a single, very human idea: a price tried to push past a level twice, failed both times, and that repeated failure says something about who is running out of strength. This post explains both shapes, the level that confirms them, and the catch that catches most beginners.
This is educational material about what these patterns are and their limits — not advice to do anything.
The double top: an M shape
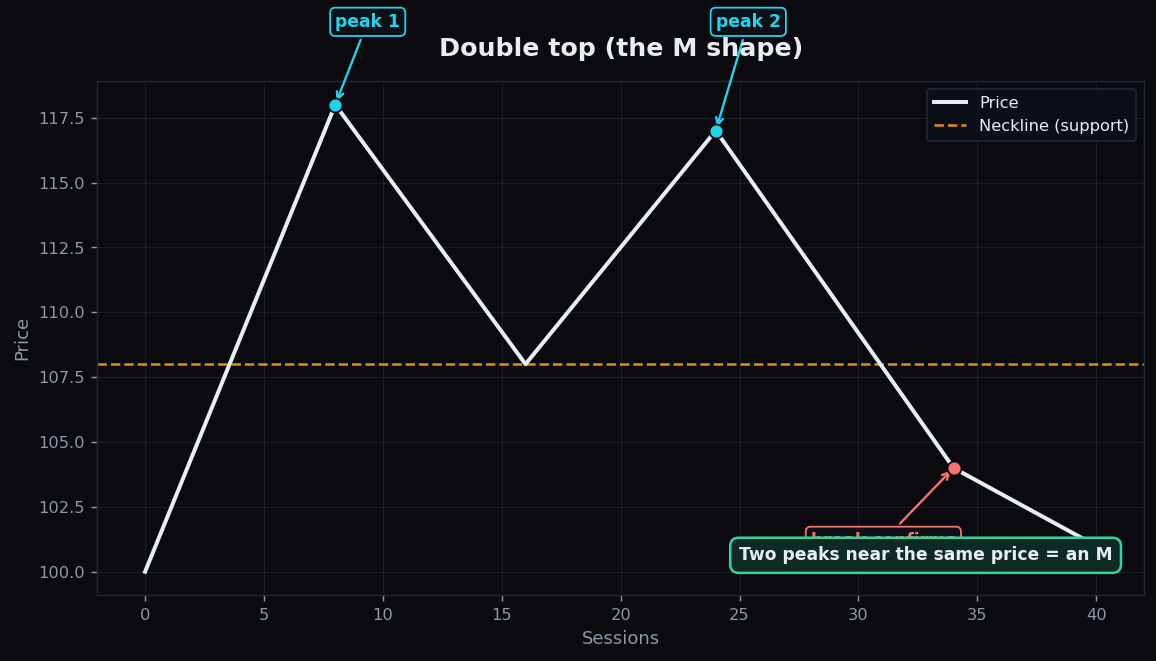
A double top forms after a rise. Price climbs to a peak, pulls back, then rallies again to roughly the same peak — and fails there a second time. Trace it and you get two humps with a dip in between: the letter M.
The analogy: think of a ceiling in a room. You jump and touch it. You jump again and touch the exact same spot — you cannot get through. After two solid attempts that go nowhere, the message is that the ceiling is holding. In market terms, buyers ran into the same wall of selling twice and could not break above it.
The double bottom: a W shape
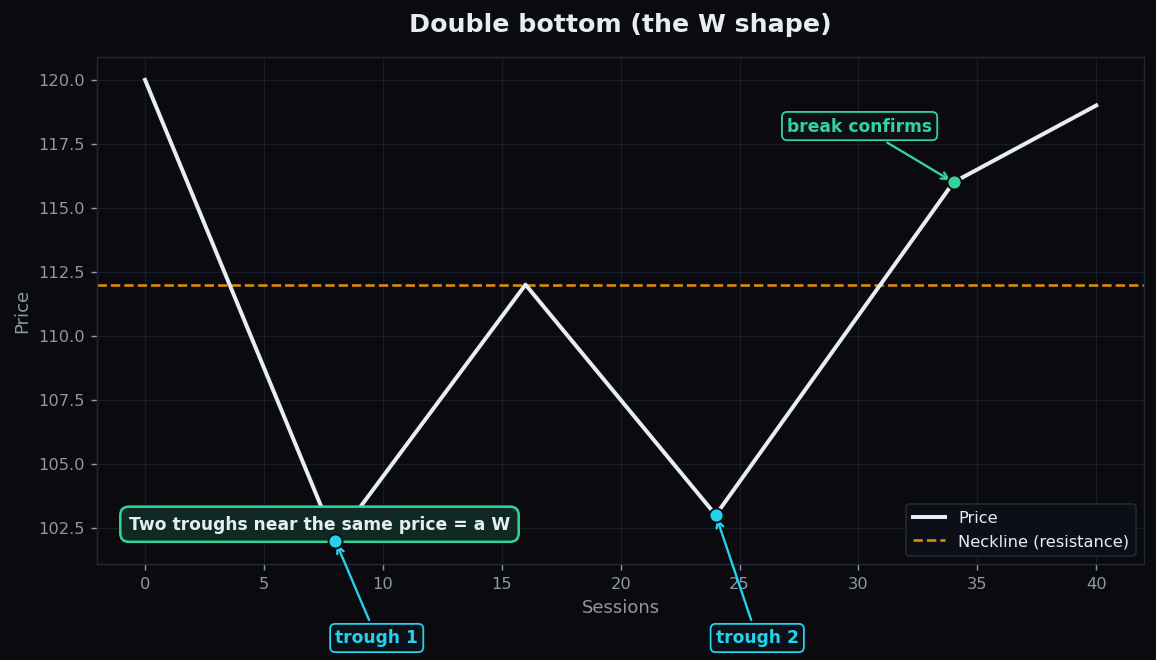
The mirror image. After a fall, price drops to a low, bounces, then falls again to roughly the same low — and holds there a second time. Two troughs with a peak between them: the letter W. Here it is a floor that buyers defended twice; sellers tried to push price lower and could not.
The neckline: confirmation on the break
Both patterns share a make-or-break level called the neckline.
- In a double top, the neckline is the dip between the two peaks — a support level. The pattern is considered confirmed only when price closes below it.
- In a double bottom, the neckline is the peak between the two troughs — a resistance level. It confirms when price closes above it.
This is the single most important discipline with these shapes. Two peaks at a similar price are not a double top until the neckline gives way. Plenty of prices touch a level twice and then carry on in the original direction. Without the break, you have an interesting shape and nothing more.
A worked example with round numbers
Say a stock rallies to 118, pulls back to a dip at 108, then rallies again and stalls at 117 — close enough to the first peak to count. The neckline sits at the 108 dip.
At this stage there is no confirmed pattern. If price later closes at 104, clearly below the 108 neckline, the double top has confirmed. As a rough measured move, chart-readers take the height of the pattern — about 118 − 108 = 10 points — and project it down from the neckline, giving a ballpark of around 98. That is a loose guide to how far the move could run, not a target and never a guarantee; real moves overshoot and undershoot all the time.
The double bottom works identically in reverse: troughs near 102–103, a neckline at the 112 peak between them, confirmation on a close above 112, and a measured move projected upward.
How these patterns are read
Careful chart-readers treat the M and the W as context, with a few habits:
- Wait for the break. The neckline close is the whole signal. Anticipating it before it happens is where most people get burned.
- Check the two extremes are roughly equal. The two peaks (or troughs) should be near the same price. Wildly different highs make a weaker pattern.
- Give it room. A double top that takes weeks to form on a daily chart is taken more seriously than two tiny bumps minutes apart.
- Use the trend backdrop. These are reversal patterns, so they mean more when there is an established trend to reverse — something tools like moving averages help you frame.
The honest catch
The M and W are seductive precisely because they are so easy to see — and that is the trap:
- The fakeout (false break). Price slips just past the neckline, triggers everyone watching, then snaps right back. This is extremely common and the number-one way these patterns disappoint.
- Premature spotting. Two touches of a level happen constantly in normal trading. Most are not reversals; they only become a “double top” in hindsight, after the break that may never come.
- It is lagging. By the time the neckline breaks, a chunk of the move has already happened. The pattern confirms late by design.
- Subjectivity. How equal must the two peaks be? How deep the middle? Reasonable people disagree, which means the “same” chart yields different patterns for different viewers.
So the value of the double top and double bottom is not predictive magic. It is a clean way to describe a level that has been tested twice and the moment that level finally fails — useful as one input, dangerous as a sole reason to act.
Easy-to-spot patterns are the easiest to over-trust. TrueTrend is built around proving things out instead of taking them on faith — our public scoreboard tracks how signals actually performed. Open a free account to study these shapes with that reality in view.
Key takeaways
- A double top (M) is two peaks at a similar price after a rise; a double bottom (W) is two troughs at a similar price after a fall.
- The neckline — the dip between the peaks or the peak between the troughs — confirms the pattern only when price closes through it.
- The measured move (pattern height projected past the neckline) is a rough guide, not a target or guarantee.
- False breaks are the most common failure; many double touches are not reversals and only look like one in hindsight.
- Read them with roughly equal extremes, enough time to form, and the wider trend — never as a standalone trigger.
See these concepts on live market data — free
Create a free TrueTrend account to watch daily support/resistance levels, market regime, and option-positioning charts on NIFTY, BankNifty and 12 more instruments. Every level we publish is scored on a public scoreboard — misses included. No card required.
Free forever tier · daily levels with published hit-rates across every instrument. Descriptive market structure, not investment advice.
Not ready for an account? Get the daily levels by email.
One short email each market day — the indices' call wall, put wall, gamma flip and max pain, and how the last session's levels scored. Free, no account, unsubscribe anytime.
Descriptive market structure, not investment advice. We never share your email.