EBITDA Explained Simply: Uses, Limits and Abuses
Open any brokerage report and one word keeps popping up: EBITDA. Analysts quote it, managements boast about it, and headlines shout it. Yet most beginners nod along without knowing what it means or why a company would prefer talking about it instead of plain old profit. This guide unpacks EBITDA in simple language, shows how it is built, and — just as importantly — where it can quietly mislead you.
What EBITDA actually stands for
EBITDA is short for Earnings Before Interest, Tax, Depreciation and Amortisation. Read the name backwards and it explains itself: it is a company's earnings before you subtract four specific things — the interest it pays on loans, the tax it owes the government, and two accounting charges called depreciation and amortisation.
Two quick definitions, because they trip people up:
- Depreciation is how a company spreads the cost of a physical asset (a machine, a truck, a factory) over the years it will be used, instead of counting the whole cost in one year.
- Amortisation is the same idea for non-physical assets like software or a purchased brand.
Neither depreciation nor amortisation is a cash payment this year. They are accounting entries. EBITDA simply says: let us look at the business before those non-cash charges and before financing and tax choices.
Building EBITDA from the top line
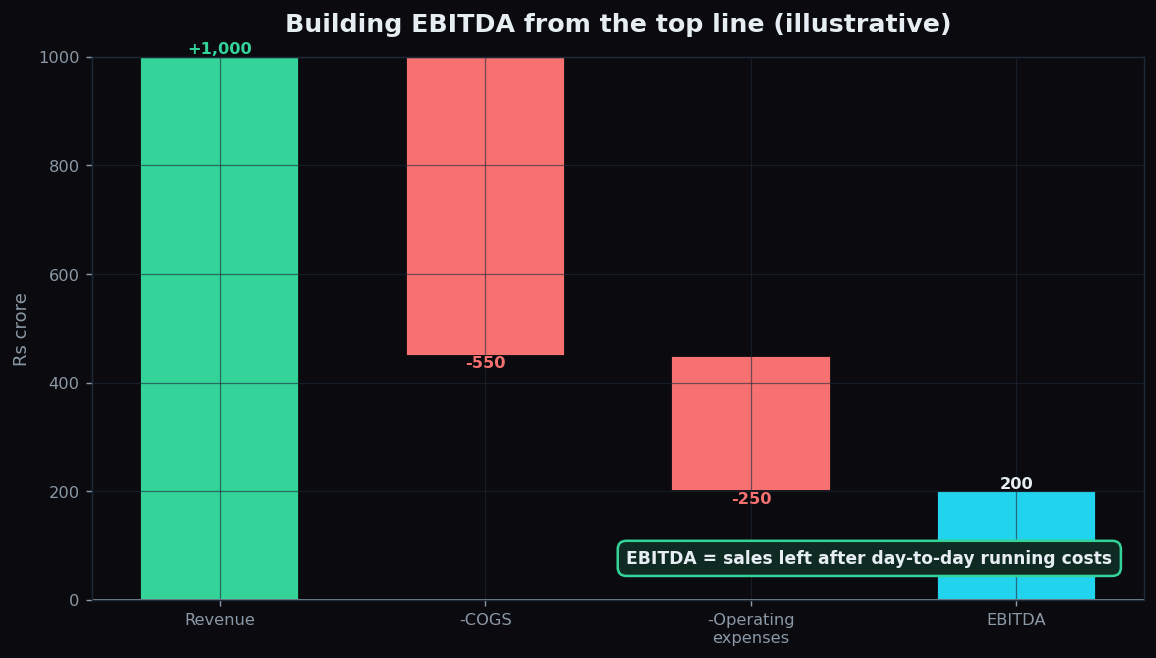
Think of a company's money like water flowing down a staircase. At the top is revenue (total sales). At each step, a cost is subtracted. EBITDA is the level you reach after removing only the day-to-day operating costs.
Here is a fully made-up example with round numbers. Imagine Vindra Foods, a fictional snacks maker:
- Revenue: Rs 1,000 crore
- Cost of goods sold (ingredients, packaging): Rs 550 crore
- Other operating expenses (salaries, rent, marketing): Rs 250 crore
Subtract the two cost buckets from revenue: 1,000 − 550 − 250 = Rs 200 crore. That Rs 200 crore is Vindra's EBITDA. It is what the core snack business earned before financing, tax, and the accounting charges for its factories.
Why investors and managers like it
EBITDA became popular for a reason: it tries to show the earning power of the operations alone, stripped of decisions that vary from company to company.
- It ignores how a company is financed. One firm may fund itself with loans (lots of interest); another with shareholder money (no interest). Removing interest lets you compare the two businesses more fairly.
- It ignores tax differences. Tax rates and holidays differ across regions and years, so removing tax makes cross-company comparison cleaner.
- It removes big non-cash charges. A capital-heavy business (say, a cement plant) books huge depreciation. EBITDA sets that aside to reveal the underlying cash the operations throw off.
Because of this, EBITDA is widely used to compare rivals in the same industry, to value companies (as a multiple, such as "8 times EBITDA"), and to check whether a business can comfortably cover its loan payments.
Analogy: EBITDA is like judging a restaurant purely on its kitchen — how good is the food and how efficiently is it cooked — before you worry about the mortgage on the building, the owner's tax bill, or the slow wear-and-tear on the ovens.
The honest catch: what EBITDA quietly hides
Here is where beginners get burned. Those four things EBITDA leaves out are not free — they are very real costs, and ignoring them can make a shaky company look strong.
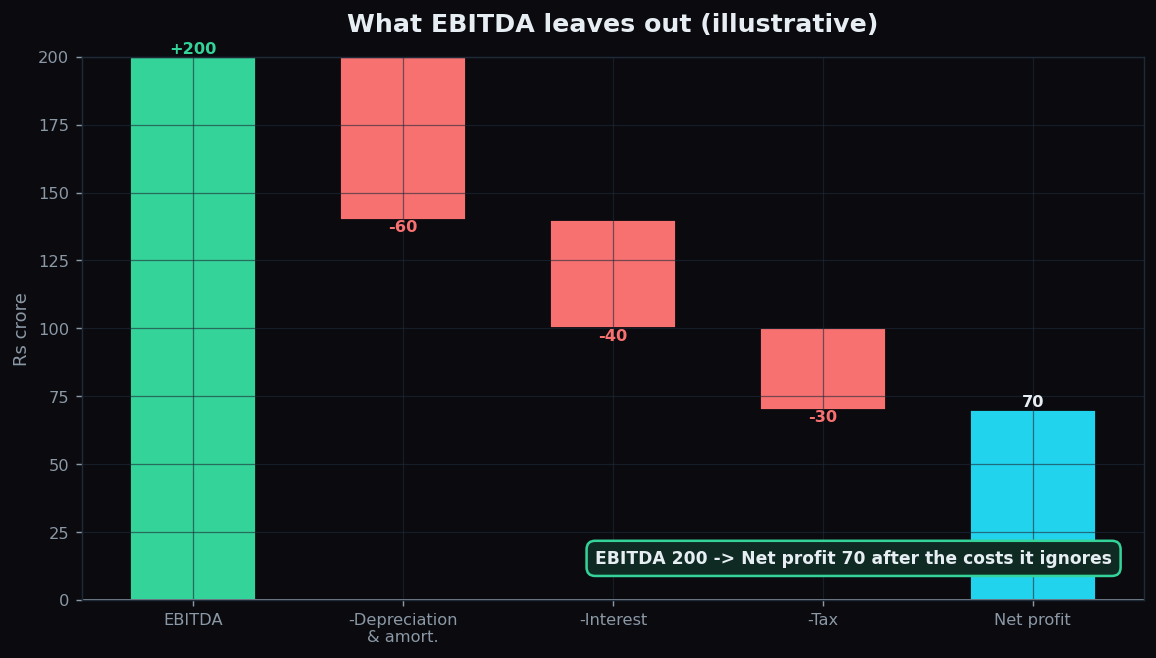
Continue the Vindra Foods example. Start from EBITDA of Rs 200 crore and subtract the items EBITDA skipped:
- Depreciation & amortisation: Rs 60 crore
- Interest on loans: Rs 40 crore
- Tax: Rs 30 crore
200 − 60 − 40 − 30 = Rs 70 crore. That Rs 70 crore is the actual net profit left for shareholders. Notice the gap: EBITDA of 200 sounds nearly three times better than the real profit of 70.
Three specific warnings:
- Depreciation is a stand-in for a real cost. Machines wear out and must be replaced. A company that keeps highlighting EBITDA while its factories quietly age may be hiding future spending it cannot avoid. The famous investor critique is blunt: does management think the tooth fairy pays for capital expenditure?
- Interest is a genuine obligation. A heavily indebted company can post glowing EBITDA and still be crushed by its loan payments. EBITDA flatters exactly the businesses that carry the most debt.
- EBITDA is not cash flow. It ignores money tied up in inventory and unpaid customer bills. A company can grow EBITDA while its bank balance shrinks.
Because it can be dressed up, EBITDA is sometimes called an "earnings before the bad stuff" number. It is a useful lens, not the whole picture. Always read it alongside net profit, debt levels, and cash flow — the same discipline behind reading free cash flow applies here too: one number in isolation rarely tells the full story.
How to use EBITDA sensibly
Used with care, EBITDA is genuinely helpful. A practical, descriptive checklist:
- Compare EBITDA within the same industry, not across wildly different ones.
- Always look at the gap between EBITDA and actual net profit. A small gap suggests few hidden costs; a large gap deserves questions.
- Pair EBITDA with the debt figure. High EBITDA plus high debt is a very different story from high EBITDA with little debt.
- Treat "adjusted EBITDA" — where companies add back even more items — with extra caution and read the fine print.
Fundamentals like EBITDA describe a business; market structure describes how its stock actually trades. TrueTrend turns raw market data into plain-English context so you can learn the mechanics without the noise. Create a free account to explore.
Key takeaways
- EBITDA = Earnings Before Interest, Tax, Depreciation and Amortisation — a view of operating earnings before financing, tax and non-cash charges.
- It helps compare companies in the same industry on a like-for-like basis and is common in valuation.
- It deliberately ignores real costs: worn-out assets (depreciation), loan interest, and tax.
- In our example, EBITDA of Rs 200 crore became just Rs 70 crore of net profit — a reminder to look past the headline.
- Never judge a company on EBITDA alone; read it next to net profit, debt and cash flow.
See these concepts on live market data — free
Create a free TrueTrend account to watch daily support/resistance levels, market regime, and option-positioning charts on NIFTY, BankNifty and 12 more instruments. Every level we publish is scored on a public scoreboard — misses included. No card required.
Free forever tier · daily levels with published hit-rates across every instrument. Descriptive market structure, not investment advice.
Not ready for an account? Get the daily levels by email.
One short email each market day — the indices' call wall, put wall, gamma flip and max pain, and how the last session's levels scored. Free, no account, unsubscribe anytime.
Descriptive market structure, not investment advice. We never share your email.