Free Cash Flow Explained: Why Cash Beats Profit
Profit gets the headlines, but seasoned investors often watch a quieter number: free cash flow. Their reasoning is simple — profit is an accountant's opinion, while cash is a fact. A company can report a rising profit and still run out of money. Free cash flow is designed to catch exactly that gap. This guide explains what it is, how it is calculated, and why it can matter more than the profit line.
What free cash flow means
Free cash flow (FCF) is the cash a business generates from its normal operations after paying for the investment needed to keep those operations running. In one line:
Free cash flow = Operating cash flow − Capital expenditure
Two terms to define:
- Operating cash flow is the actual cash that came in from selling the company's products and services, after paying suppliers, staff and other running costs. Unlike profit, it counts real money moving in and out, not accounting estimates.
- Capital expenditure (capex) is money spent on long-lived assets — new machines, buildings, vehicles, technology — that the business needs to keep operating and growing.
What is left after subtracting capex is "free" in a specific sense: it is the cash the company can use however it likes — repay debt, build a cash cushion, or reward owners — without starving the business of the tools it needs.
A simple worked example
Take a fictional logistics firm, Marlo Transport. In one year:
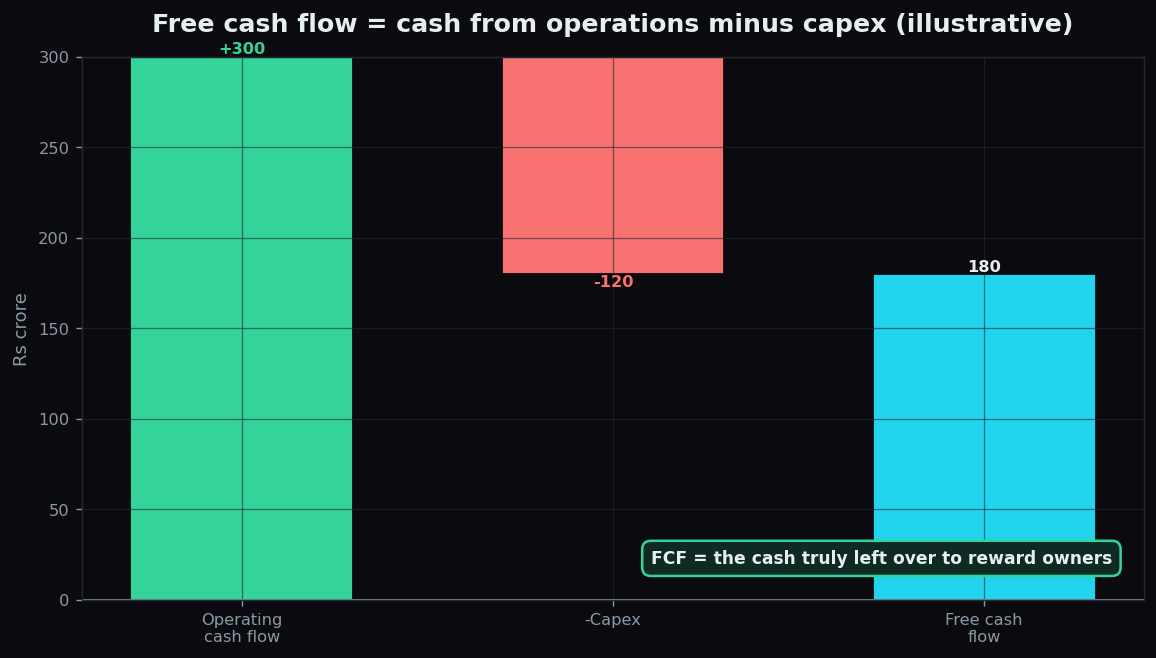
- Operating cash flow: Rs 300 crore
- Capex (new trucks and a depot): Rs 120 crore
Free cash flow = 300 − 120 = Rs 180 crore. That Rs 180 crore is real, spendable cash the business produced beyond what it needed to reinvest. It is the money that can genuinely reward the people who own and lend to the company.
Why it can matter more than profit
Reported profit follows accounting rules that involve estimates and timing choices. Some of those choices do not move cash at all. Here is the crucial idea, shown with a deliberately awkward example.
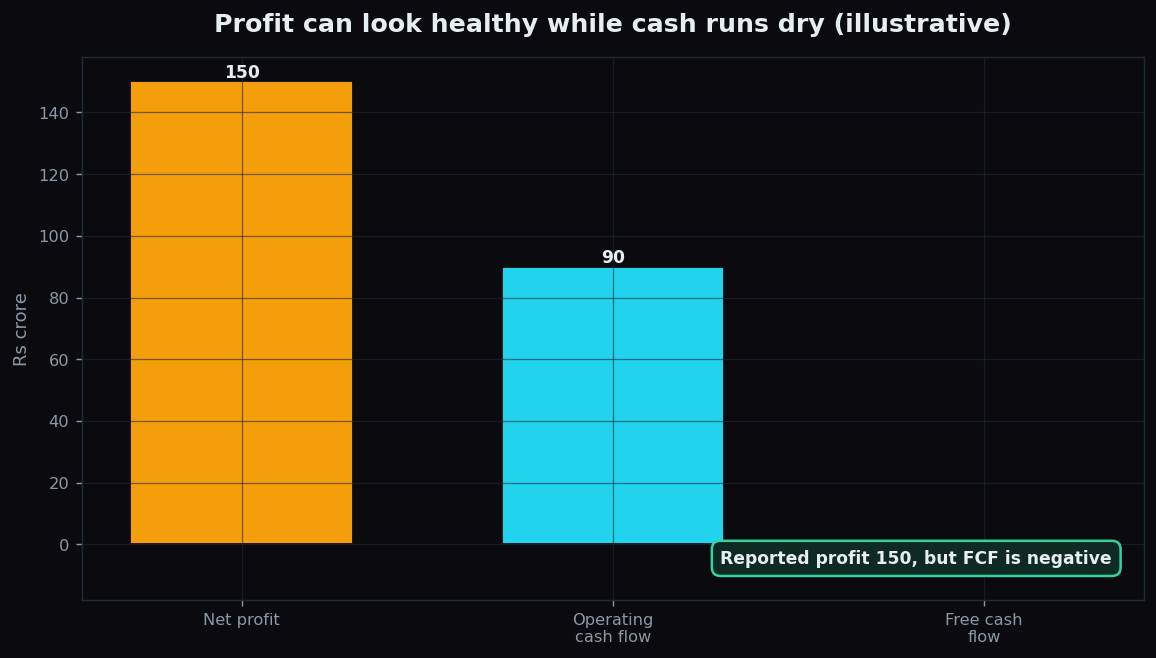
Imagine Kesar Retail, a fictional chain that reports a healthy Rs 150 crore net profit. Impressive — until you follow the cash:
- A large chunk of "sales" was on credit, so the cash has not actually arrived. Operating cash flow is only Rs 90 crore.
- The chain is opening stores aggressively, spending Rs 100 crore on capex.
Free cash flow = 90 − 100 = −Rs 10 crore. The business looks profitable on paper yet is consuming cash. To keep expanding it may need to borrow or raise money. Nothing illegal is happening — but the profit headline hid the strain that free cash flow exposed.
This is why analysts prize FCF:
- It is hard to fake. Cash either arrived or it did not. Profit involves more judgement.
- It funds real choices. Debt repayment and shareholder rewards ultimately come from cash, not from an accounting profit figure.
- It reveals quality. A company whose cash flow tracks its profit year after year tends to have cleaner, more dependable earnings.
Analogy: profit is like your salary on paper; free cash flow is what is left in your bank account after rent and buying the tools you need for work. You can look well-paid and still be short of cash at month-end.
How free cash flow is used
Free cash flow shows up in several everyday judgements about a business:
- Valuation. Many valuation methods discount a company's expected future free cash flows to estimate what the whole business is worth today.
- Financial health. Consistently positive FCF means a company can largely fund itself. Persistently negative FCF means it depends on outside money.
- Dividend durability. Payouts made comfortably out of free cash flow are more sustainable than payouts funded by new borrowing.
- Comparing rivals. Two firms with identical profit can look very different once you see who actually generates spare cash.
The honest catch
Free cash flow is powerful, but it is not a magic number.
- It can be lumpy. A single big investment year — a new factory — can push FCF negative for a genuinely healthy, growing company. One year in isolation can mislead; look at the trend over several years.
- Capex is a slippery line. Companies decide what counts as "maintenance" versus "growth" spending, so FCF can be nudged by classification choices.
- Timing tricks exist. Delaying supplier payments or squeezing customers can flatter cash flow for a quarter without any real improvement.
- Negative is not always bad. A young company investing heavily to grow may burn cash deliberately — the question is whether those investments will pay off.
The sensible habit is to read free cash flow across several years, next to profit and debt, rather than trusting a single figure. Context beats any lone metric — the same lesson behind reading EBITDA alongside the full cash picture.
Understanding a company's fundamentals is one half of the story; understanding how its stock trades is the other. TrueTrend translates live market structure into plain English so beginners can learn the mechanics calmly. Start free and explore at your own pace.
Key takeaways
- Free cash flow = operating cash flow − capital expenditure — the real cash left after keeping the business running.
- It can matter more than profit because cash is a fact while profit involves accounting judgement.
- In our example, a Rs 150 crore profit turned into negative free cash flow once credit sales and store expansion were counted.
- FCF underpins valuation, financial health checks and dividend durability.
- Read it over several years and beside profit and debt — a single lumpy year can mislead.
See these concepts on live market data — free
Create a free TrueTrend account to watch daily support/resistance levels, market regime, and option-positioning charts on NIFTY, BankNifty and 12 more instruments. Every level we publish is scored on a public scoreboard — misses included. No card required.
Free forever tier · daily levels with published hit-rates across every instrument. Descriptive market structure, not investment advice.
Not ready for an account? Get the daily levels by email.
One short email each market day — the indices' call wall, put wall, gamma flip and max pain, and how the last session's levels scored. Free, no account, unsubscribe anytime.
Descriptive market structure, not investment advice. We never share your email.