Expected Move: How Option Prices Show the Day's Likely Range
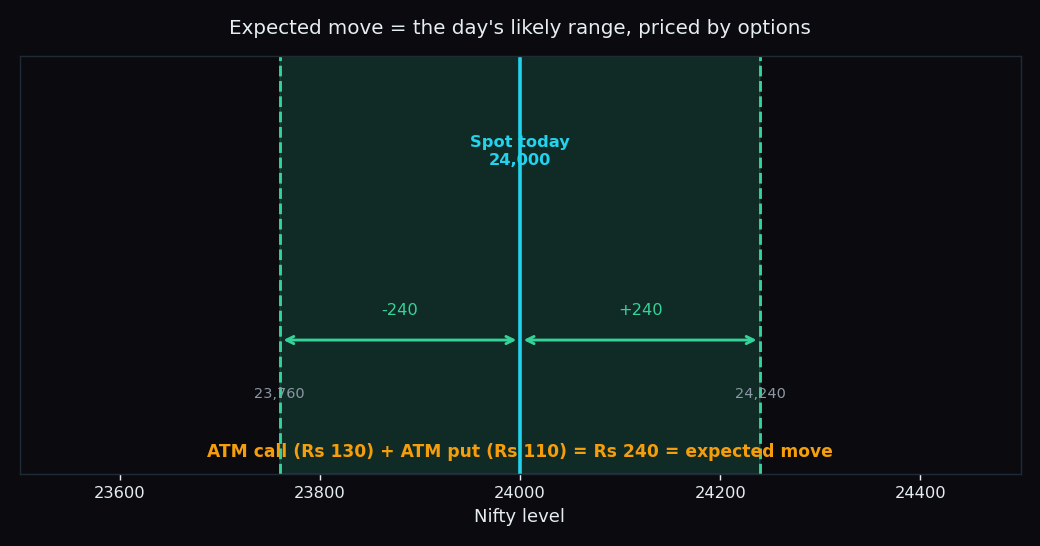
One morning the Nifty is sitting at 24,000. You want a quick, honest answer to a simple question: how far is it likely to move by the close? You do not need a guru or a hunch — the option market has already priced an answer. Add up two option prices and you get the expected move: roughly ±240 points, a band from about 23,760 to 24,240. This is what option prices quietly tell you about the day's likely range.
What “expected move” actually means
An option is a contract that pays off if the index moves; its price (the premium) is what traders pay for that chance. When a big move looks likely, options get expensive. When things look calm, they get cheap. So the price of options is really a crowd estimate of how much the index might swing.
The expected move is that estimate turned into a number: the size of the range the option market is pricing for a given period — a day, a week, or up to expiry. Think of it like a weather forecast. A good forecaster does not say “it will be exactly 32 degrees.” They say “around 32, give or take a few.” The expected move is the market's “give or take” for price.
The straddle shortcut: add two option prices
Here is the back-of-the-napkin method most traders use. First, find the at-the-money (ATM) strike — the strike price closest to where the index is trading now. Then look at two options at that strike: the call (pays off if price rises) and the put (pays off if price falls). Buying both together is called a straddle. The rule of thumb:
Expected move ≈ ATM call price + ATM put price.
Worked example, with round numbers. Nifty is at 24,000, so the 24,000 strike is at-the-money. Suppose the ATM call costs ₹130 and the ATM put costs ₹110. Add them: 130 + 110 = ₹240. For an index option, one point of premium maps to one index point, so the market is pricing an expected move of about ±240 points — a likely range of roughly 23,760 to 24,240 by expiry.
That is the whole trick. You did not predict a direction. You read the width of the day straight off the option prices.
Why the range is about a two-in-three zone
The expected move is not a hard wall. It is built to be a one standard deviation range. “Standard deviation” is just a statistician's way of saying typical wobble: how far things usually stray from the average. For a normal spread of outcomes, about 68% — roughly two days out of three — land inside one standard deviation, and about one in three land outside it.
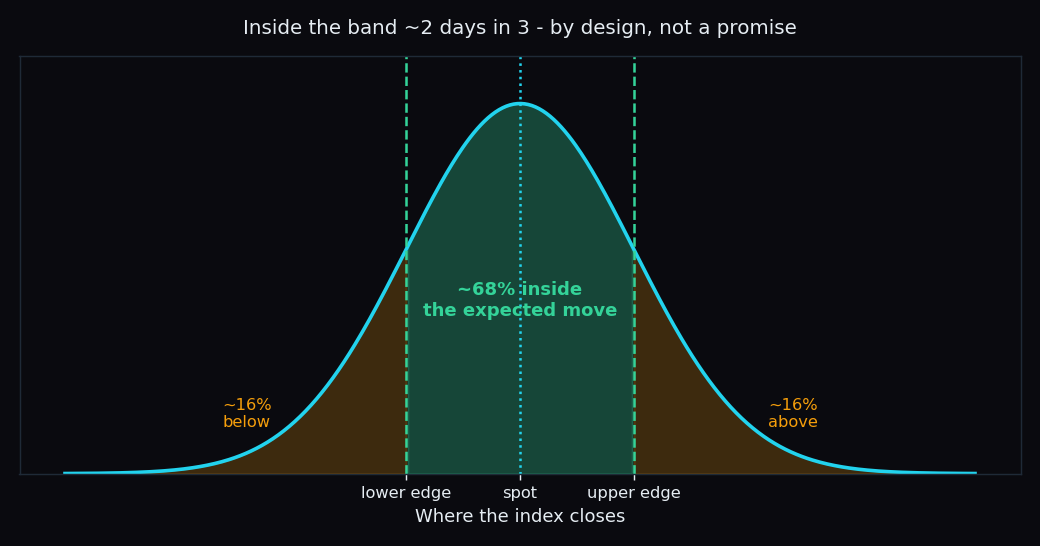
So when you read an expected move of ±240, you are really reading: “there is roughly a two-thirds chance the close lands inside this band, and a one-third chance it pokes out.” A breakout beyond the band is not a shock or a failure of the method — it is the one-in-three case the math openly expects.
Why the band widens before big events
The single biggest driver of the expected move is implied volatility (IV) — the amount of future movement baked into option prices. Before a budget, an election result, an RBI policy decision, or a heavyweight earnings day, traders bid options up because anything could happen. Higher option prices mean a wider expected move. On a sleepy, news-free afternoon, options sag and the band narrows.
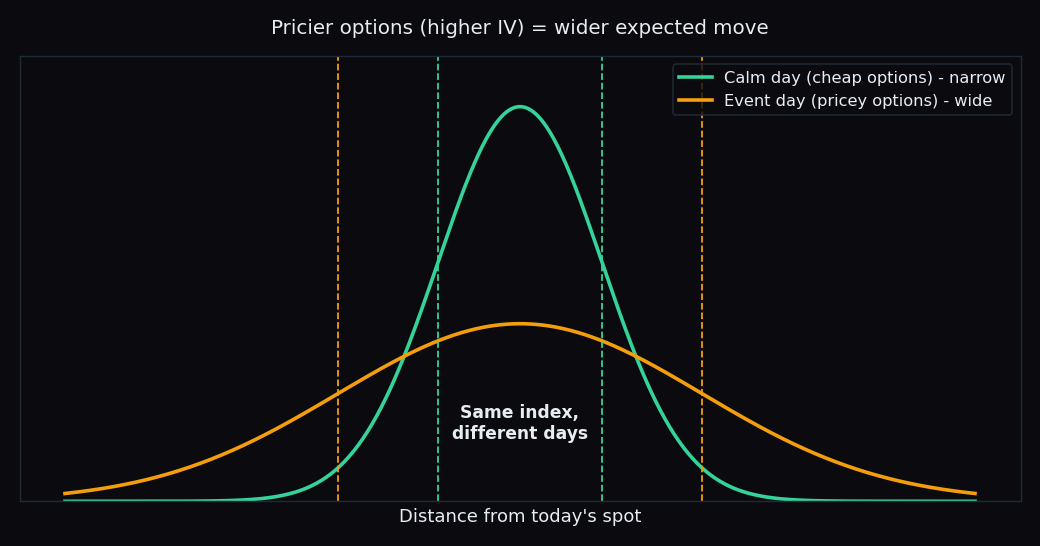
This is why two mornings at the very same index level can imply completely different ranges. Same Nifty, different days — the option market is telling you which day it thinks will be wild and which will be quiet.
How market participants read it
The expected move is a context tool, not a signal to act on. A few common, descriptive uses:
- Sizing up a move. If the index has already travelled 300 points and the day's expected move was only 200, the move is large relative to what was priced — useful context, not a verdict.
- Setting expectations. Knowing the band keeps you from being surprised by an ordinary day inside it, or from over-reading a normal wobble.
- Cross-checking option levels. The expected-move band sits naturally alongside other option-structure reads, like the heavy strikes where sellers cluster. If you are new to those, start with what open interest is and why it matters and whether option walls actually hold.
The honest catch
The expected move describes structure, never destiny. It is a probability band, not a fence. About a third of the time price closes outside it, and on event days that band can be enormous. It also says nothing about direction — only width.
How much do markets really roam, even around the strongest option-pricing anchors? On our public scoreboard, the Nifty closed within one strike of its max-pain level in just 39% of 51 scored sessions, and Bank Nifty in only 8% of 50. In other words, even a well-known magnet level pins the close a minority of the time. Read the expected move as a likely range to respect, not a promise to lean on.
Key takeaway: add the at-the-money call and put to read the day's expected range — then remember it is a two-in-three zone, not a guarantee. Roughly one day in three breaks out, by design.
TrueTrend turns this kind of option-structure read into a clear, at-a-glance picture across Nifty, Bank Nifty and F&O — and scores how its own levels actually played out, in public. See the daily read on TrueTrend.
See these concepts on live market data — free
Create a free TrueTrend account to watch daily support/resistance levels, market regime, and option-positioning charts on NIFTY, BankNifty and 12 more instruments. Every level we publish is scored on a public scoreboard — misses included. No card required.
Free forever tier · daily levels with published hit-rates across every instrument. Descriptive market structure, not investment advice.
Not ready for an account? Get the daily levels by email.
One short email each market day — the indices' call wall, put wall, gamma flip and max pain, and how the last session's levels scored. Free, no account, unsubscribe anytime.
Descriptive market structure, not investment advice. We never share your email.