Hammer and Shooting Star Candlesticks Explained
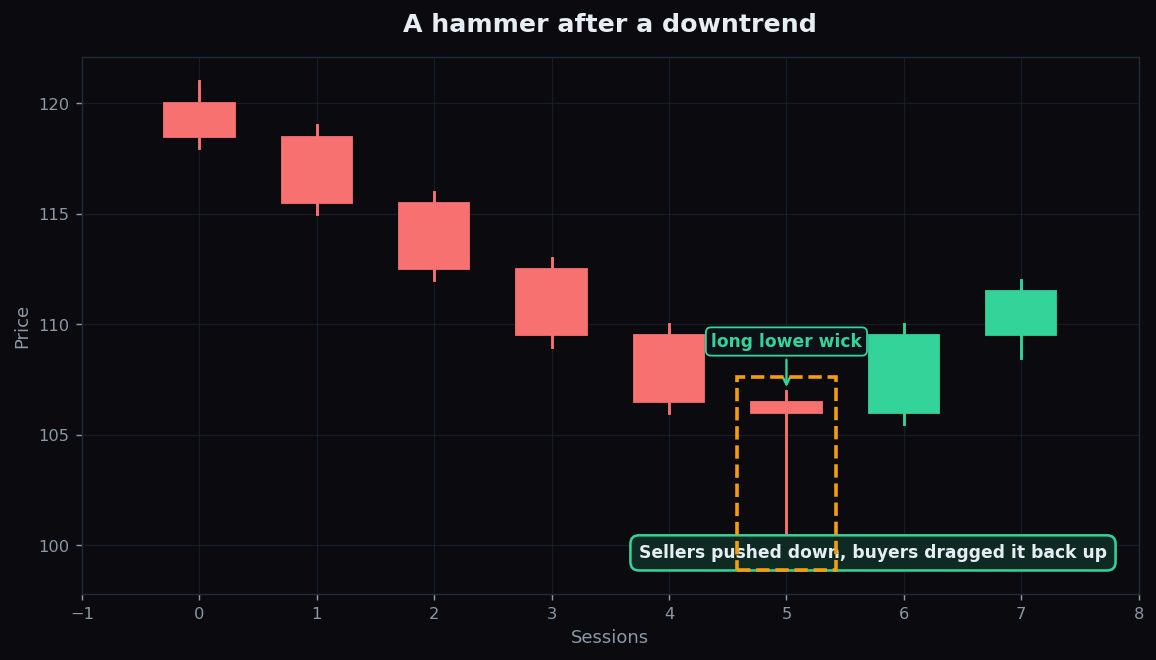
Some candlesticks earn their reputation from a single dramatic feature: a long wick that sticks out like a tail. The hammer and the shooting star are the two most famous of these. They are near-mirror images of each other, and both tell a vivid little story about a fight that got reversed before the closing bell. This guide explains what they are, where they appear, and why their location is everything.
First, the parts of the candle
A quick refresher. Each candle has a body (the open-to-close range, drawn thick) and wicks, also called shadows (the thin lines marking the high and low price touched). For these two patterns, the body is small and one wick is unusually long. That long wick is the whole point: it shows price travelled far in one direction during the session, then got pushed almost all the way back.
The hammer
A hammer has a small body sitting near the top of its range, with a long lower wick and little or no upper wick. The long tail below shows that sellers drove price sharply down during the session — but by the close, buyers had hauled it back up near where it opened. The selling was rejected.
The shape is named for what it looks like — a hammer, with the head at the top and the handle hanging down. A useful detail: where it appears is half its meaning. A hammer becomes interesting specifically after a downtrend, because that is when "sellers tried to push lower and failed" actually says something new.
The shooting star
A shooting star is the upside-down twin. It has a small body near the bottom of its range, with a long upper wick and little lower wick. The long tail above shows that buyers spiked price sharply up during the session — but sellers slammed it back down to close near the open. The buying was rejected.
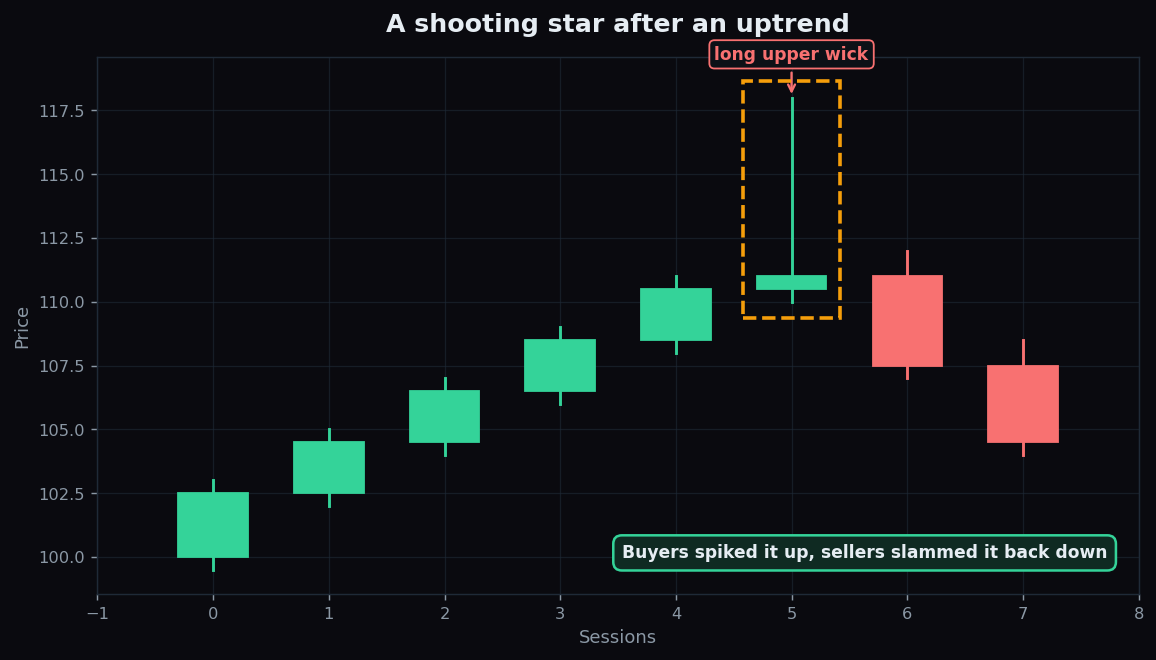
The name fits: a bright streak shooting up, then fading. Like the hammer, location matters. A shooting star carries meaning specifically after an uptrend, where "buyers tried to push higher and failed" is fresh information about a stalling advance.
An analogy for both
Picture a beach ball held underwater and released — it rockets to the surface. That is the hammer: sellers shoved price down, but it sprang back up by the close. Now picture throwing that same ball high into the air — it rises, slows, and falls back. That is the shooting star: buyers launched price up, but it dropped back by the close. In both, the long wick is the part of the journey that got undone.
A worked example with round numbers
Here is an illustrative example — round numbers to teach the idea, not a recommendation. A stock in a downtrend opens at ₹200, falls to ₹188 as sellers pile in, then recovers to close at ₹199. The body (200 to 199) is tiny; the lower wick (down to 188) is long. That is a hammer: a 12-rupee dive almost entirely erased. Flip it for a shooting star — open ₹200, spike to ₹212, close back at ₹201 — a long upper wick where a sharp rally was given back.
Why the location is the whole game
This is the single most important idea about these candles: the same shape means different things in different places. A hammer-shaped candle in the middle of a calm, sideways range is just a candle with a long wick. The same candle at the bottom of a sustained decline is a "long-wick rejection" that chart readers actually pay attention to, because it describes a clear shift in who was winning. The pattern needs a preceding trend to push against:
- A hammer is read as a potential bottoming clue — but only after a clear downtrend.
- A shooting star is read as a potential topping clue — but only after a clear uptrend.
Without that trend behind it, the long wick is noise. With it, the long wick describes a genuine change in the session's balance of buyers and sellers. For a smoothed sense of which trend a candle is reacting against, our moving averages guide pairs naturally with this one.
The honest catch
These are evocative patterns, which makes it easy to over-trust them:
- They describe one session, not the future. A rejection candle says what just happened; the next move is still uncertain.
- They fail often. A textbook hammer can be followed by more selling the very next day. There is no certain outcome.
- "Long enough" is subjective. How long must the wick be, and how small the body? Different readers use different rules of thumb.
- Confirmation matters. Most readers wait for the following candles — and often heavier volume — before treating the pattern as meaningful.
- Colour is secondary. A hammer can be green or red; what matters is the long lower wick and small body, not the body's colour.
Read honestly, the hammer and shooting star are clean ways to describe a rejected move at the end of a trend — vivid, memorable, and never a promise about tomorrow.
Want to see how long-wick candles actually play out — the failures shown right next to the follow-throughs? TrueTrend publishes an open analytics scoreboard so you can weigh the evidence for yourself.
Key takeaways
- A hammer has a small body near the top and a long lower wick — sellers pushed down, buyers pushed back.
- A shooting star has a small body near the bottom and a long upper wick — buyers pushed up, sellers pushed back.
- Location is everything: a hammer matters after a downtrend, a shooting star after an uptrend.
- The long wick shows a move that was rejected before the close — a change in the session's balance, not a forecast.
- They fail often, "long enough" is subjective, and the body's colour is secondary — treat them as descriptive, not predictive.
See these concepts on live market data — free
Create a free TrueTrend account to watch daily support/resistance levels, market regime, and option-positioning charts on NIFTY, BankNifty and 12 more instruments. Every level we publish is scored on a public scoreboard — misses included. No card required.
Free forever tier · daily levels with published hit-rates across every instrument. Descriptive market structure, not investment advice.
Not ready for an account? Get the daily levels by email.
One short email each market day — the indices' call wall, put wall, gamma flip and max pain, and how the last session's levels scored. Free, no account, unsubscribe anytime.
Descriptive market structure, not investment advice. We never share your email.