The Iron Condor Explained (Illustrative Example)
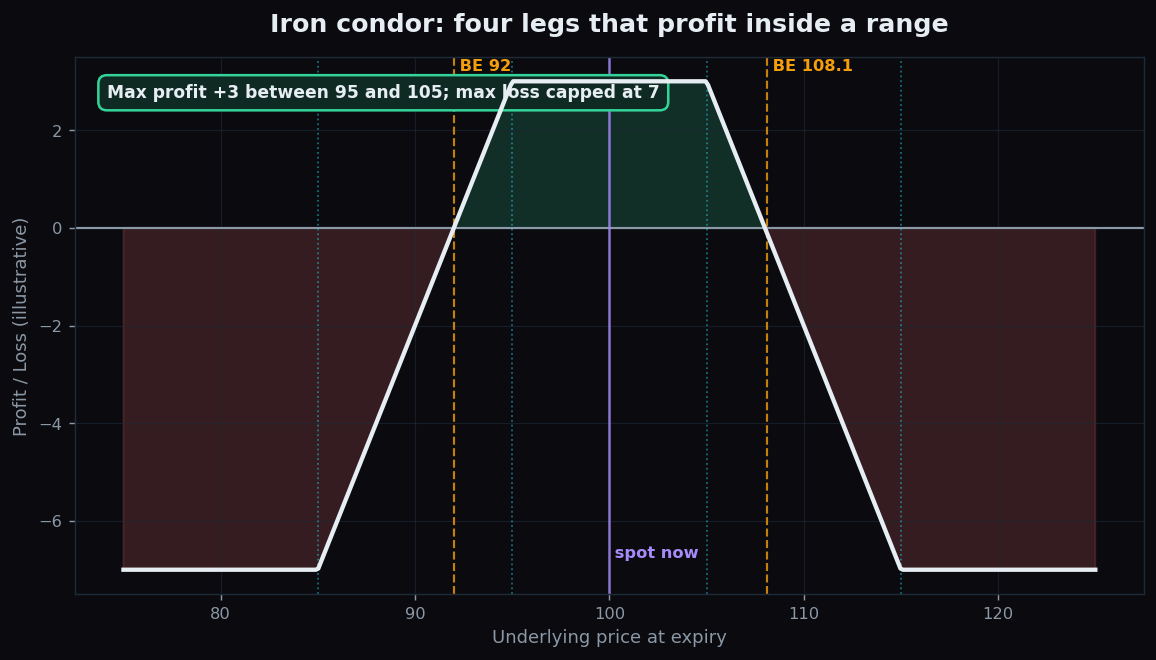
The iron condor is a four-legged option structure with a memorable goal: it profits when a stock stays quiet and finishes inside a range. Where a straddle bets on a big move, an iron condor bets on the opposite — that nothing dramatic happens. It is built to earn a small, capped income while risking a defined, capped amount. This article breaks down all four legs with round numbers. It is an illustrative example to explain how the structure works — not a recommendation, and not a trade to place.
What an iron condor actually is
An iron condor is really two simpler structures bolted together, both sold for income:
- A bear call spread above the current price: sell a call at a nearer strike, buy a call at a further strike for protection.
- A bull put spread below the current price: sell a put at a nearer strike, buy a put at a further strike for protection.
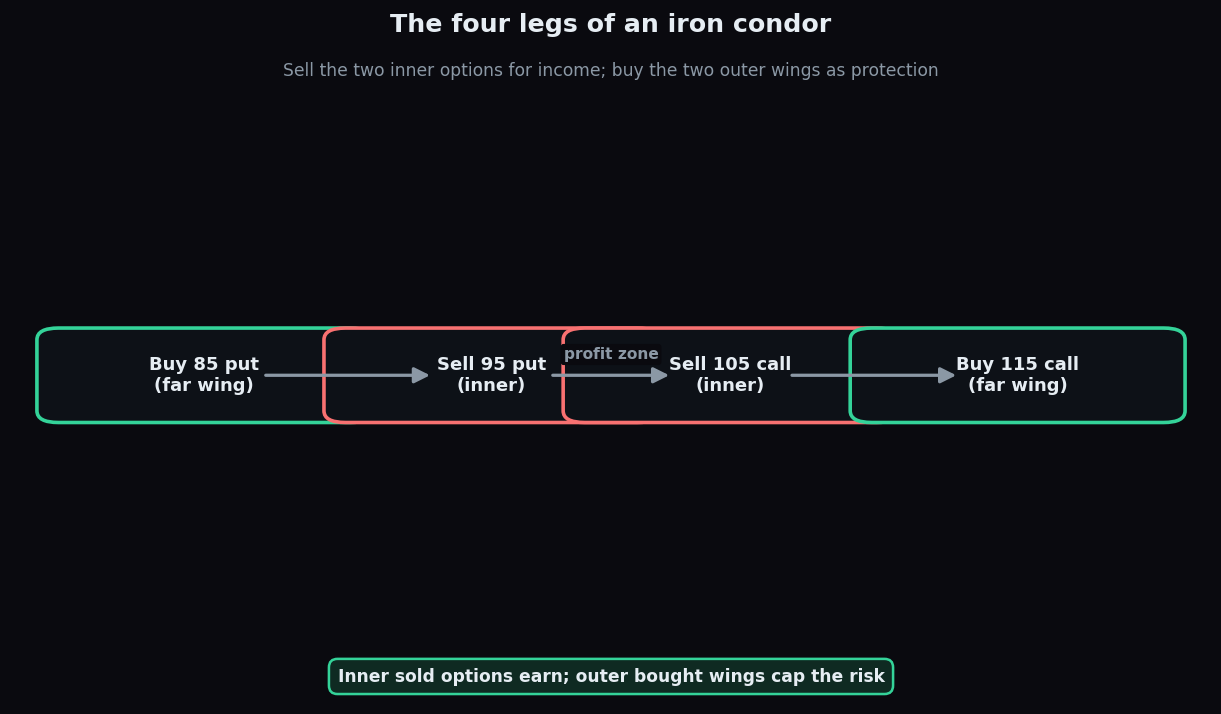
You sell the two inner options (nearer the price) to collect premium, and you buy the two outer options (the “wings”) to cap your risk. The net premium you collect upfront is the net credit. As long as the stock stays between the two inner strikes at expiry, all four options behave kindly and you keep that credit. The bought wings mean that even if the stock blows through a side, your loss stops at a known ceiling.
Picture a shopkeeper who sells insurance policies to two neighbours — one worried about prices rising, one worried about them falling — and collects both premiums. To protect himself, he buys cheaper backstop cover further out on each side. If prices stay calm, nobody claims and he keeps the fees. If there is a big swing, one neighbour claims, but his backstop limits how much he can lose.
A worked example with round numbers
A stock trades at 100. You build the condor with four legs, all the same expiry:
- Sell the 105 call for 2, and buy the 115 call for 0.5 (the call side).
- Sell the 95 put for 2, and buy the 85 put for 0.5 (the put side).
Premium collected is 2 + 2 = 4; premium paid for wings is 0.5 + 0.5 = 1. Your net credit is 3. At expiry:
- Stock anywhere between 95 and 105. All four options expire worthless. You keep the full net credit of 3 — the maximum profit, earned in the calm middle.
- Stock at 108. The 105 call you sold is worth 3 against you, but you collected 3 in credit, so you are roughly at breakeven. The upper breakeven is 105 + 3 = 108; the lower is 95 − 3 = 92.
- Stock at 120 (a big move up). The 105/115 call spread reaches its maximum value of 10. Minus your 3 credit, your loss is capped at 7. The bought 115 wing is what stops the loss from growing beyond that.
So: maximum profit 3 (between 95 and 105), maximum loss 7 (beyond either wing), and breakevens at 92 and 108. The width between the inner and outer strikes is 10, and 10 minus the 3 credit equals the 7 maximum loss — a handy check.
Why people study it
The iron condor is the classic lesson in selling time and range. Its profit does not need the stock to go anywhere — it needs the stock to not go far. Every day that passes with the price stuck in the middle, time decay quietly works in the seller’s favour, because the options they sold lose value. It is the structural opposite of the long straddle, which needs a big move to win.
It also teaches defined risk elegantly. Both the best case (3) and the worst case (7) are known before you enter, and the bought wings are what make an otherwise dangerous “sell options” position have a firm floor.
The honest catch: what can go wrong
The comforting shape hides an uncomfortable maths problem worth stating plainly:
- The risk-reward is lopsided. In this example you risk 7 to make 3. You can win more often than you lose and still end up behind if the occasional loss is more than double a typical win. The wide, calm middle can lull you into underrating that.
- A big move is the enemy. The whole position is a bet against drama. A surprise gap through a wing delivers the maximum loss quickly, and gaps do not respect your breakevens.
- Four legs, four sets of costs. You pay bid-ask spreads and charges on all four options. On a structure whose max profit is already small, that friction bites.
- Early assignment risk. The short inner options can be assigned before expiry, complicating the position around dividends or sharp moves.
The distance of the inner strikes from the current price is the key dial. Placing them wide gives a bigger safe zone but collects less credit; placing them close collects more credit but leaves a narrow margin for error. That balance is the entire craft of the structure.
A range-based idea lives or dies on knowing the move the market has already priced in. TrueTrend turns option open interest and expected range into plain-English context. Explore TrueTrend free and read where the market thinks the boundaries are.
Key takeaways
- An iron condor is a bear call spread plus a bull put spread — four legs that profit when the stock stays in a range.
- In the example: sell the 95 put and 105 call, buy the 85 put and 115 call → net credit 3, max profit 3, max loss 7, breakevens 92 and 108.
- You sell the inner options for income and buy the outer wings to cap the risk.
- The catch: the risk (7) is bigger than the reward (3), a big move triggers the max loss fast, and four legs mean heavy friction.
- This is an educational illustration of the mechanics, with made-up numbers — not advice and not a trade to place.
See these concepts on live market data — free
Create a free TrueTrend account to watch daily support/resistance levels, market regime, and option-positioning charts on NIFTY, BankNifty and 12 more instruments. Every level we publish is scored on a public scoreboard — misses included. No card required.
Free forever tier · daily levels with published hit-rates across every instrument. Descriptive market structure, not investment advice.
Not ready for an account? Get the daily levels by email.
One short email each market day — the indices' call wall, put wall, gamma flip and max pain, and how the last session's levels scored. Free, no account, unsubscribe anytime.
Descriptive market structure, not investment advice. We never share your email.