Straddle and Strangle Explained (Illustrative Example)
Most option ideas take a side: up or down. Straddles and strangles are different — they are ways to bet on movement itself, in either direction, without picking which way. You buy both a call and a put at the same time, so a big enough move up or down can pay off. What you are really wagering on is volatility. This article explains both structures with round numbers. It is an illustrative example to explain how they work — not a recommendation, and not a trade to place.
What straddles and strangles actually are
Two quick reminders. A call option gains value when the stock rises above its strike; a put option gains value when the stock falls below its strike. Each costs an upfront premium. If you buy both on the same stock, one side profits when the price moves far enough — regardless of direction.
- A long straddle buys a call and a put at the same strike (usually near the current price). It is the purest “I expect a big move, I just don’t know which way” position.
- A long strangle buys a call and a put at different, out-of-the-money strikes — the call above the price, the put below. It is cheaper than a straddle, but needs an even bigger move to pay off.
Think of it like buying tickets to both the home and away fan sections before a match, unsure who will win. You pay for both. If the game is a blowout either way, one ticket was worth it. If the match is a dull draw, both were a waste. You are not betting on who wins — you are betting on a dramatic result.
Worked example 1: the straddle
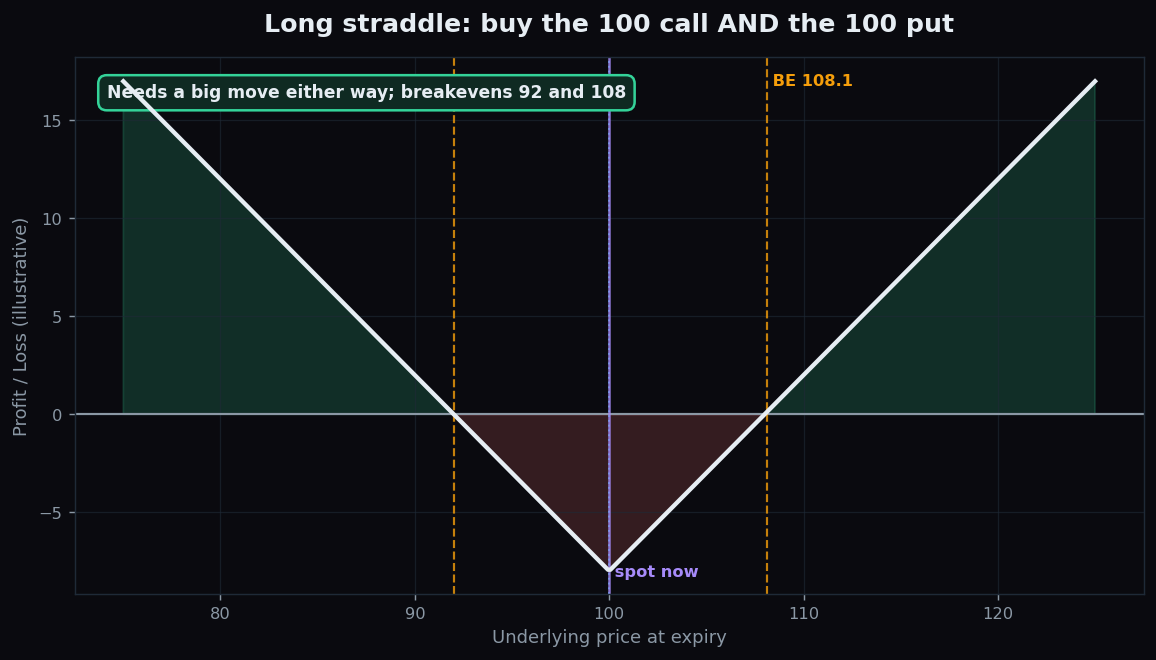
A stock trades at 100. You buy the 100 call for 4 and the 100 put for 4. Your total cost is 8. At expiry:
- Stock at 100. Both options expire worthless. You lose the full 8 — the worst case, which happens when nothing moves.
- Stock at 108. The call is worth 8, the put is worthless. You recover your 8 cost — the upper breakeven.
- Stock at 92. The put is worth 8, the call is worthless. Again you recover 8 — the lower breakeven.
- Stock at 120. The call is worth 20, minus your 8 cost, for a profit of 12.
So a straddle here needs the stock to finish outside 92 to 108 just to break even. Inside that band, it loses money. The maximum loss (8) is fixed; the profit grows the further the stock travels from 100 in either direction.
Worked example 2: the strangle
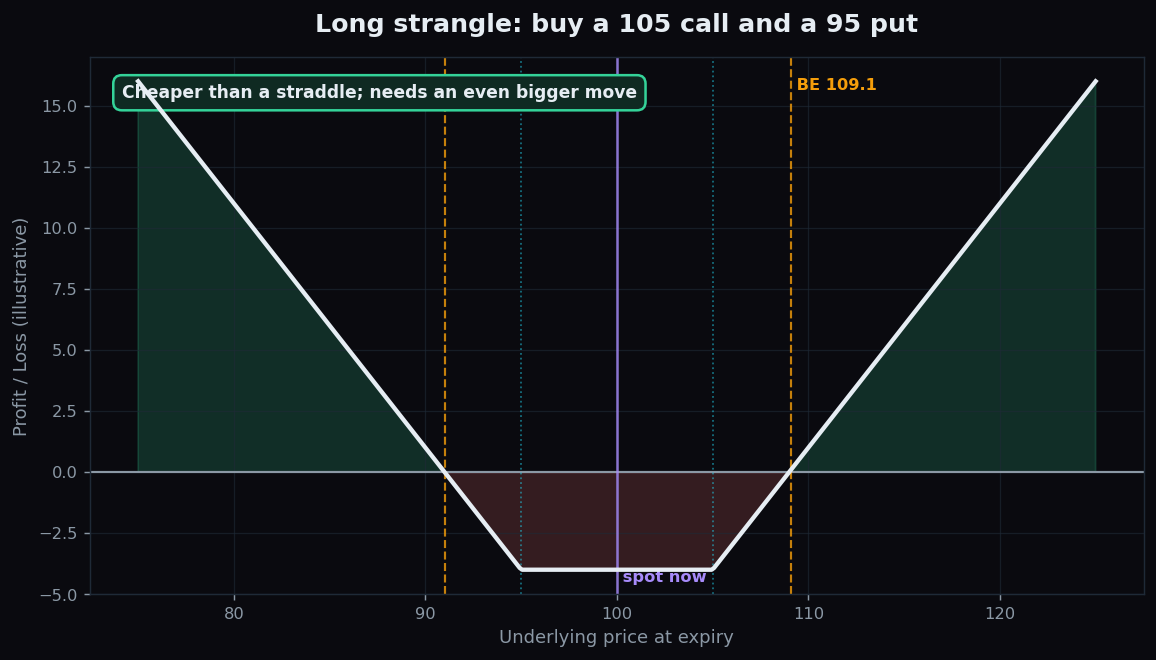
Same stock at 100. Now you buy the 105 call for 2 and the 95 put for 2. Total cost 4 — half the straddle. At expiry:
- Stock between 95 and 105. Both expire worthless. You lose the full 4. Notice the loss zone is wider than the straddle’s.
- Stock at 109. The 105 call is worth 4, recovering your cost — the upper breakeven (105 + 4).
- Stock at 91. The 95 put is worth 4 — the lower breakeven (95 − 4).
So the strangle costs less upfront (4 vs 8) but demands a bigger move to profit: outside 91 to 109 rather than 92 to 108. That is the core trade-off between the two — cheaper entry, higher hurdle.
Why people study them
These structures teach a crucial idea: option prices contain a built-in expectation of movement, often called the expected move. A straddle roughly prices in how far the market thinks the stock will travel. Buying one is a bet that the actual move will be bigger than that priced expectation — a wager on volatility being underestimated, not on direction. Traders study them before events like earnings, when a large move is plausible but its direction is genuinely unknown.
The honest catch: what can go wrong
Betting on movement sounds clever, but it has sharp downsides worth stating plainly:
- You pay for two options. You are long two premiums, so the hurdle to profit is high. The stock must move a lot, not a little.
- Time decay hurts twice. Both options lose value every day the big move fails to arrive. A stock that drifts sideways bleeds a straddle dry.
- The volatility crush. This is the classic trap. Before an event, implied volatility is high, so the options are expensive. After the event, volatility collapses and both options can lose value even if the stock moves — the move simply was not big enough to beat what you paid. See why an option can lose value after a move.
- Being “right” is not enough. The stock can move in your expected direction and you can still lose, if it does not clear the breakeven.
The single most useful thing before studying a volatility structure is knowing the move already priced in. TrueTrend surfaces the expected daily range and option positioning in plain English. Explore TrueTrend free and read the market’s own expectations first.
Key takeaways
- A long straddle buys a call and put at the same strike; a long strangle buys them at wider, cheaper strikes.
- Straddle example: buy the 100 call and 100 put for 8 → breakevens 92 and 108, max loss 8 at the strike.
- Strangle example: buy the 105 call and 95 put for 4 → breakevens 91 and 109 — cheaper, but needs a bigger move.
- Both are bets on volatility, not direction; the profit grows with the size of the move.
- The catch: high premium hurdle, double time decay, and the volatility crush can sink even a “right” call.
- This is an educational illustration of the mechanics, with made-up numbers — not advice and not a trade to place.
See these concepts on live market data — free
Create a free TrueTrend account to watch daily support/resistance levels, market regime, and option-positioning charts on NIFTY, BankNifty and 12 more instruments. Every level we publish is scored on a public scoreboard — misses included. No card required.
Free forever tier · daily levels with published hit-rates across every instrument. Descriptive market structure, not investment advice.
Not ready for an account? Get the daily levels by email.
One short email each market day — the indices' call wall, put wall, gamma flip and max pain, and how the last session's levels scored. Free, no account, unsubscribe anytime.
Descriptive market structure, not investment advice. We never share your email.