Monsoon and the Markets: How Rainfall Moves Indian Stocks
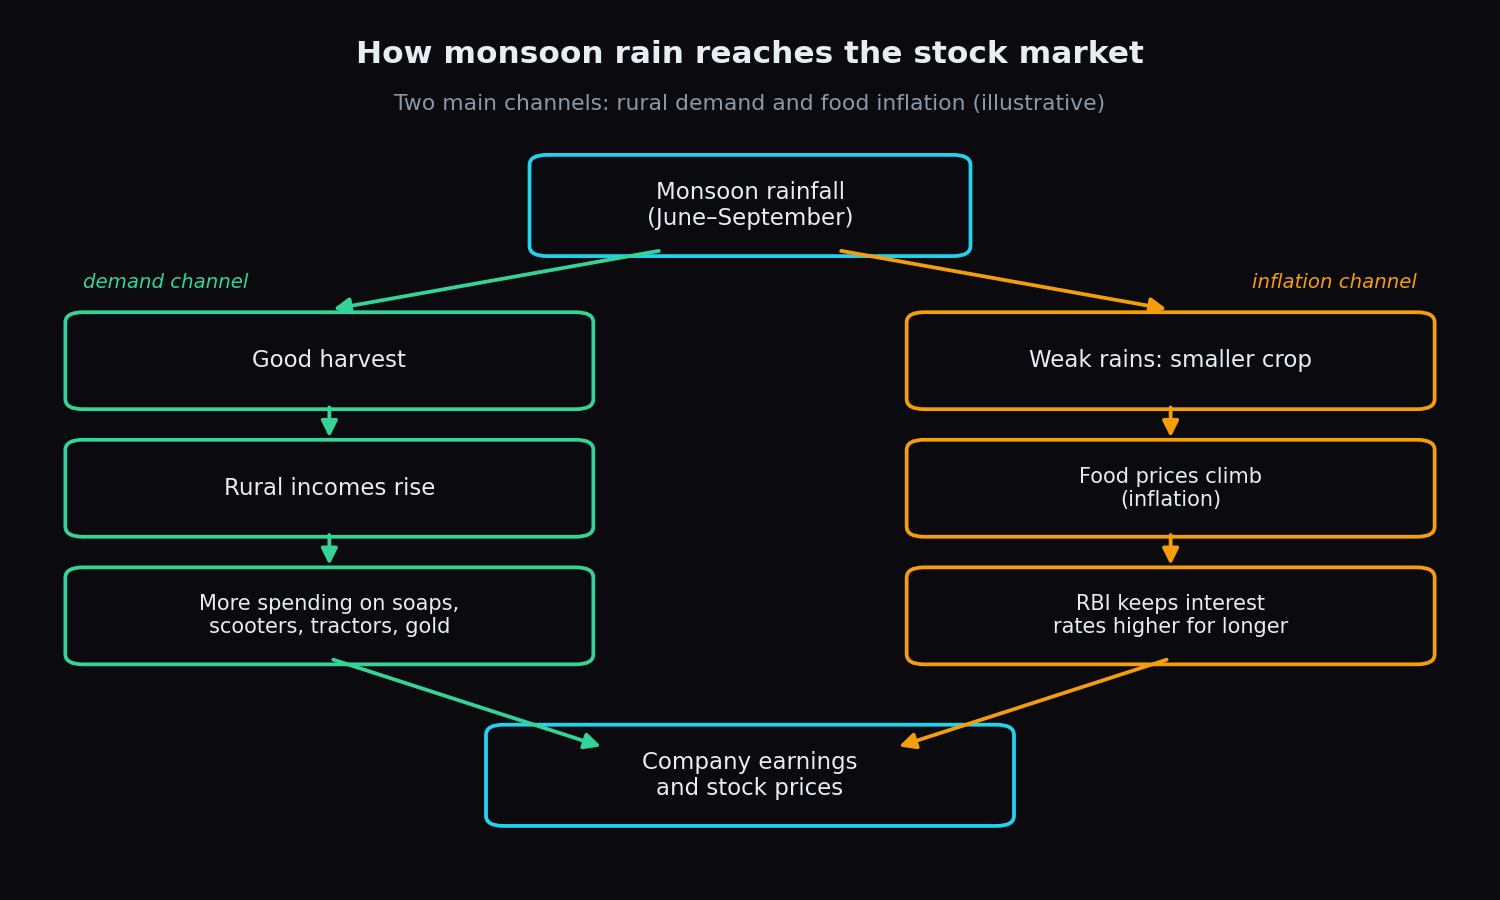
Every year between June and September, a single weather system — the southwest monsoon — delivers roughly 70% of all the rain India gets in a year. Roughly half of India's farmland has no irrigation and depends on that rain directly. So when the India Meteorological Department (IMD) updates its monsoon forecast, dealing rooms in Mumbai pay attention. This post explains, step by step, how water falling on a field in Vidarbha ends up moving stock prices on the NSE.
What the monsoon actually is
The southwest monsoon is a seasonal wind pattern that carries moisture from the Indian Ocean over the subcontinent from roughly June to September. The IMD measures the season against a benchmark called the Long Period Average (LPA) — the average rainfall of the season over the past 50 years, currently about 87 cm. A season near 100% of LPA is "normal"; far below it is a drought year.
Here is a simple analogy. Think of the monsoon as the annual watering of one giant national garden. If the watering is on time and sufficient, the garden produces well and everyone who lives off the garden has money to spend. If the watering fails, the garden produces less, the people who tend it earn less, and food from the garden costs more for everyone else. Both effects — less spending and costlier food — travel all the way to company profits and stock prices.
Channel 1: rural demand
Agriculture contributes roughly a sixth of India's GDP, but it supports far more of its people — roughly two out of five Indian workers depend on farming. A good harvest means higher rural incomes, and rural India is a huge customer for listed companies: packaged goods (soaps, biscuits — the sector called FMCG, fast-moving consumer goods), two-wheelers, tractors, fertilisers, and gold jewellery.
When rains are good, analysts expect stronger sales for these companies and mark up their earnings estimates. When rains fail, the same logic runs in reverse. That is the demand channel in the diagram above.
Channel 2: food inflation and the RBI
The second channel runs through prices. Food and beverages make up roughly half of India's consumer price index (CPI) — the basket used to measure inflation. A weak monsoon means smaller crops of vegetables, pulses and grains, which pushes food prices up.
The Reserve Bank of India (RBI) aims to keep CPI inflation around 4%. If food inflation climbs because of a poor monsoon, the RBI becomes reluctant to cut interest rates — and may hold them higher for longer. Higher rates raise borrowing costs for companies and make fixed deposits more attractive relative to equities. This channel touches every stock, not just rural-facing ones, which is why even IT investors glance at rainfall maps in June.
How a monsoon season is graded
The IMD grades the whole season as a percentage of the LPA. The commonly used bands: below 90% is deficient, 90–95% is below normal, 96–104% is normal, 105–110% is above normal, and beyond that is excess.
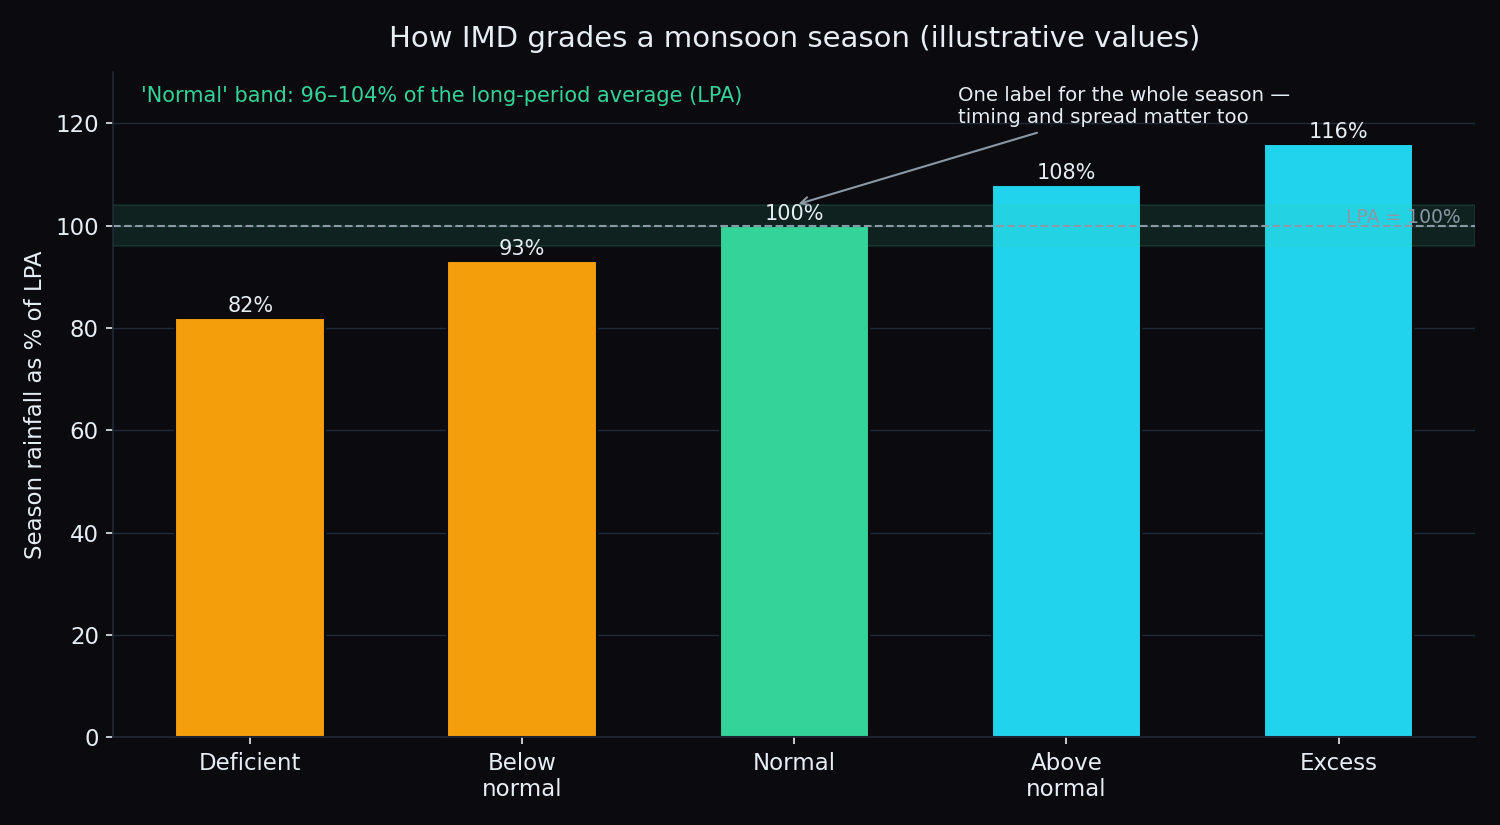
One caution the chart flags: this is one label for a whole season. Rain that arrives in the wrong weeks, or floods one state while another stays dry, can hurt crops even in a "normal" year. Timing and spread matter as much as the total.
A worked example with simple numbers
Imagine a farm family whose harvest is worth ₹1,00,000 in a normal year. They spend ₹50,000 on essentials, ₹30,000 on extras — a scooter down payment, a TV, some gold — and save ₹20,000.
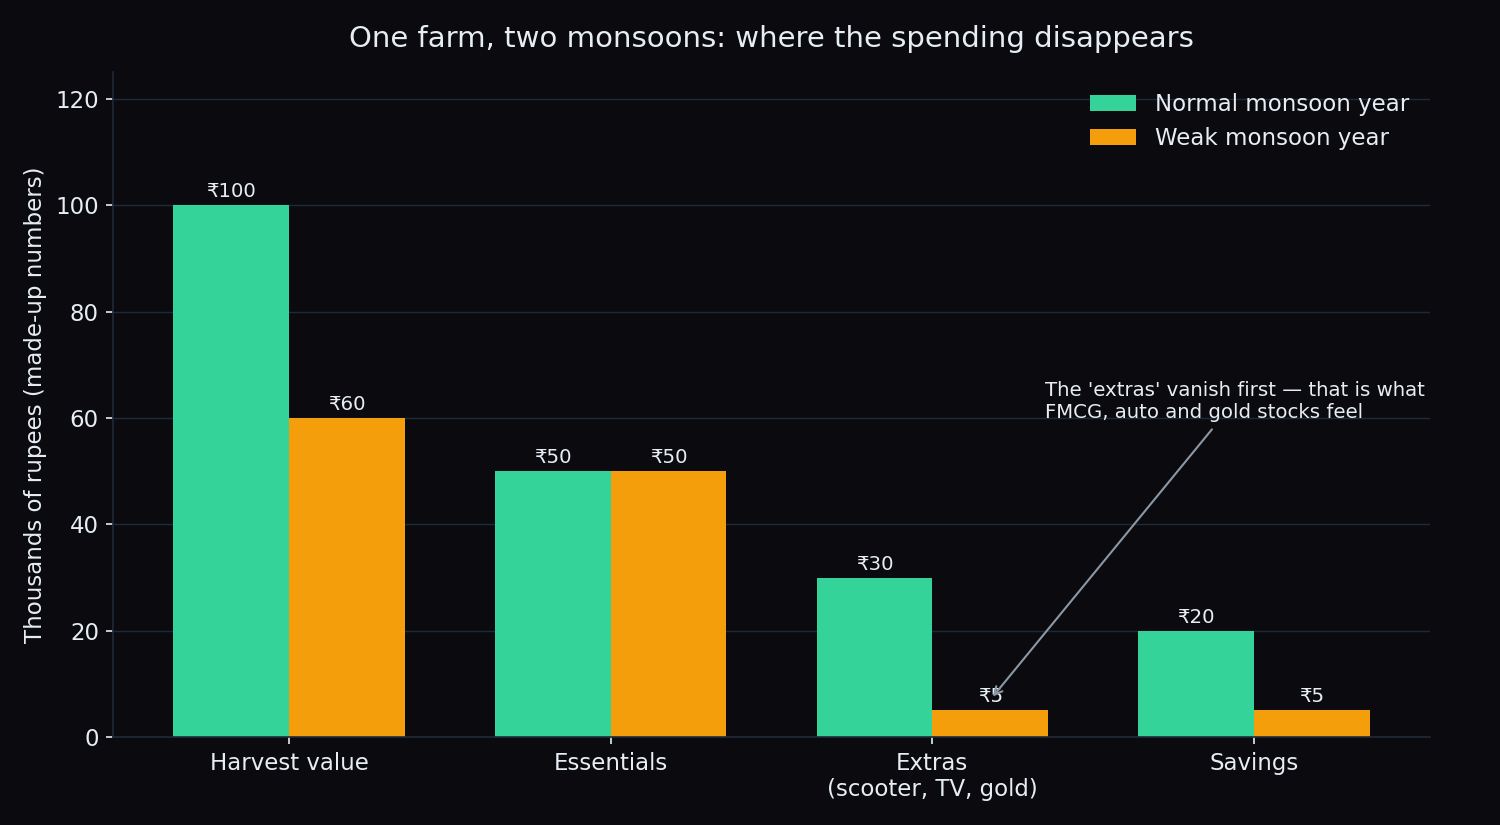
Now a weak monsoon cuts the harvest to ₹60,000. Essentials cannot shrink — the family still eats and pays school fees. So the ₹40,000 hole comes almost entirely out of extras and savings. The scooter purchase is postponed; the gold can wait. Scale that decision across a few hundred million rural consumers and you can see why two-wheeler and FMCG stocks react to rainfall data: the "extras" are exactly what those companies produce.
Which sectors watch the rain most closely
- FMCG — rural demand is a large slice of volumes for soaps, biscuits and hair oil.
- Two-wheelers and tractors — classic post-harvest purchases; tractor volumes are a widely tracked rural-health signal.
- Fertilisers and agrochemicals — demand tracks sowing; a delayed monsoon delays the whole season.
- Banks with rural books — loan repayment in farm belts weakens after a poor crop.
- Everything else, via the RBI — through the food-inflation channel described above.
The honest catch
Now the part the headlines skip: the link between rainfall and the index is real but loose. Four reasons:
- Markets look forward. By the time a drought is official in September, stock prices have usually been adjusting since the first weak forecast in April. As we explain in how stock prices move, prices react to surprises, not to what is already known.
- Forecasts carry wide error bands. Seasonal rainfall forecasts are genuinely hard; early-season predictions have missed in both directions, and an El Niño year often — though not always — means weaker rains.
- Agriculture's index weight is small. Nifty 50 earnings are dominated by banks, IT, energy and autos. The monsoon reaches them only indirectly, so a bad season dents the index far less than it dents a fertiliser stock.
- India has changed. Irrigation cover has grown over the decades, so each percentage point of rainfall shortfall hurts output less than it once did.
Key takeaway: treat the monsoon as a slow-moving input to rural earnings and inflation — not as a switch that flips the whole market. A "normal" IMD headline can hide bad timing, and a scary forecast is often priced in before the first cloud arrives.
So the next time a monsoon update flashes across your screen, you will know the two questions that matter: what does this do to rural incomes, and what does it do to food prices? The answers move earnings and interest rates — and those, not the rain itself, are what move stocks.
Rainfall is one input; positioning is another. TrueTrend turns daily market structure across Nifty, Bank Nifty and F&O into a clear, at-a-glance read — and scores its own record in public on the scoreboard. Create a free account to see today's picture.
See these concepts on live market data — free
Create a free TrueTrend account to watch daily support/resistance levels, market regime, and option-positioning charts on NIFTY, BankNifty and 12 more instruments. Every level we publish is scored on a public scoreboard — misses included. No card required.
Free forever tier · daily levels with published hit-rates across every instrument. Descriptive market structure, not investment advice.
Not ready for an account? Get the daily levels by email.
One short email each market day — the indices' call wall, put wall, gamma flip and max pain, and how the last session's levels scored. Free, no account, unsubscribe anytime.
Descriptive market structure, not investment advice. We never share your email.