Mutual Funds and NAV Explained for Beginners
Most people start investing not by picking stocks, but by putting money into a mutual fund. It is one of the simplest ways to own a slice of many companies at once, managed by professionals, without doing the research yourself. But two questions trip up almost every beginner: where does my money actually go, and what is this “NAV” number I keep seeing? This post answers both in plain language — what a mutual fund is, how NAV is calculated, and why NAV alone tells you less than people think.
What a mutual fund is
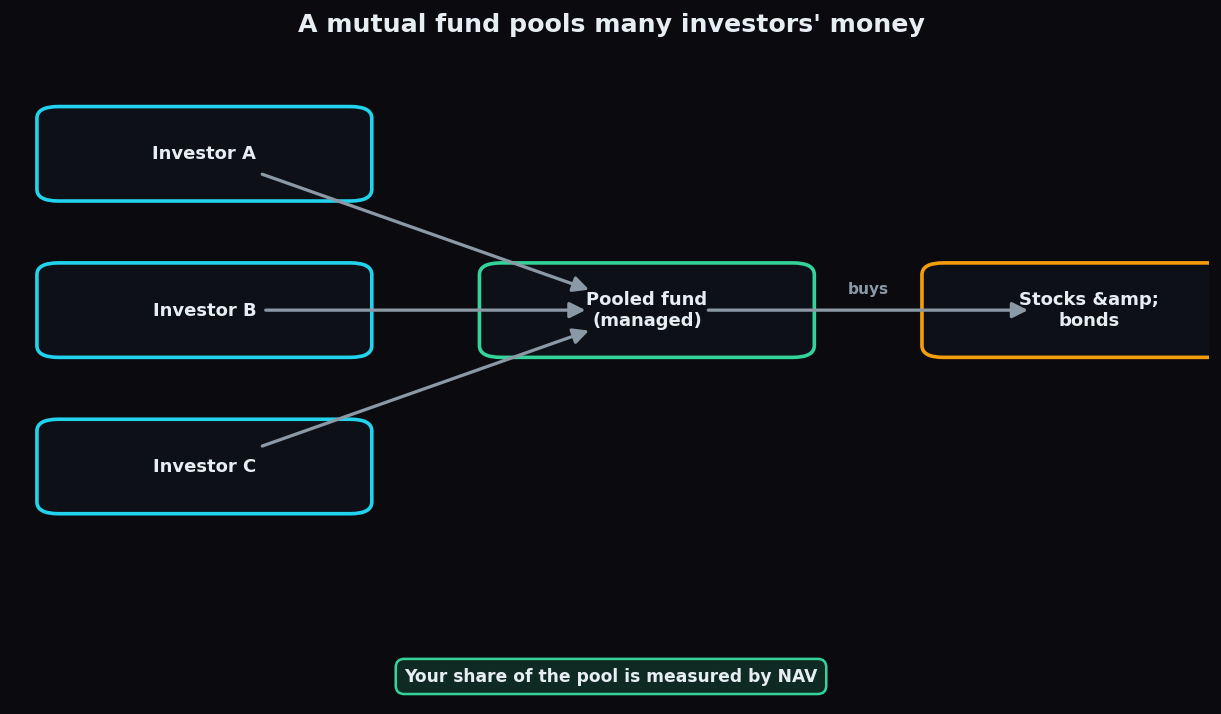
A mutual fund is a pool of money collected from many investors, managed together by a professional fund manager who invests it in a mix of assets — typically stocks, bonds, or both — according to a stated goal. Instead of each person buying shares individually, everyone contributes to a common pot, and the manager buys and sells on behalf of the whole group.
When you invest, you are not handed specific shares. You are given units of the fund — a measure of how big your share of the pool is. If the pool's investments do well, the value of each unit rises; if they do poorly, it falls. Everyone in the fund rises and falls together, in proportion to how many units they hold.
An everyday analogy
Picture a group of neighbours who each chip in for a shared vegetable garden. Nobody owns a particular tomato plant; instead, each person owns a share of the whole garden based on how much they contributed. A gardener (the fund manager) decides what to plant and when to harvest. When the garden thrives, every contributor's share is worth more. A mutual fund works the same way: pooled contributions, shared ownership, a professional tending the whole plot.
What NAV means
NAV stands for Net Asset Value. It is the price of one unit of the fund. The word “net” is the key: it is what remains after the fund's small running costs are subtracted from the total value of everything it owns. In one line:
NAV per unit = (Total value of the fund's holdings − the fund's costs) ÷ Total number of units
So NAV is simply the pool's net worth, sliced evenly across all outstanding units. If the fund owns Rs 100 crore of assets, owes Rs 1 crore in costs, and has issued 9.9 crore units, then each unit is worth about Rs 10.
A worked example with round numbers
Let's build a tiny fund from scratch.
- On day one, 1,000 investors each put in Rs 10. The pool has Rs 10,000.
- The fund issues 1,000 units, so the starting NAV is Rs 10 per unit (Rs 10,000 ÷ 1,000).
- The manager buys stocks. Over a few months those holdings grow in value to Rs 12,000.
- Ignoring costs for a moment, the new NAV is Rs 12,000 ÷ 1,000 units = Rs 12 per unit.
- If you owned 50 units, your stake went from Rs 500 to Rs 600 — a 20% rise, matching the pool.
Now subtract the fund's tiny daily running cost, and the NAV would be a fraction below Rs 12 — say Rs 11.98. That gap is the fee at work. These are clean, illustrative numbers to show the mechanics, not a forecast.
How and when NAV changes
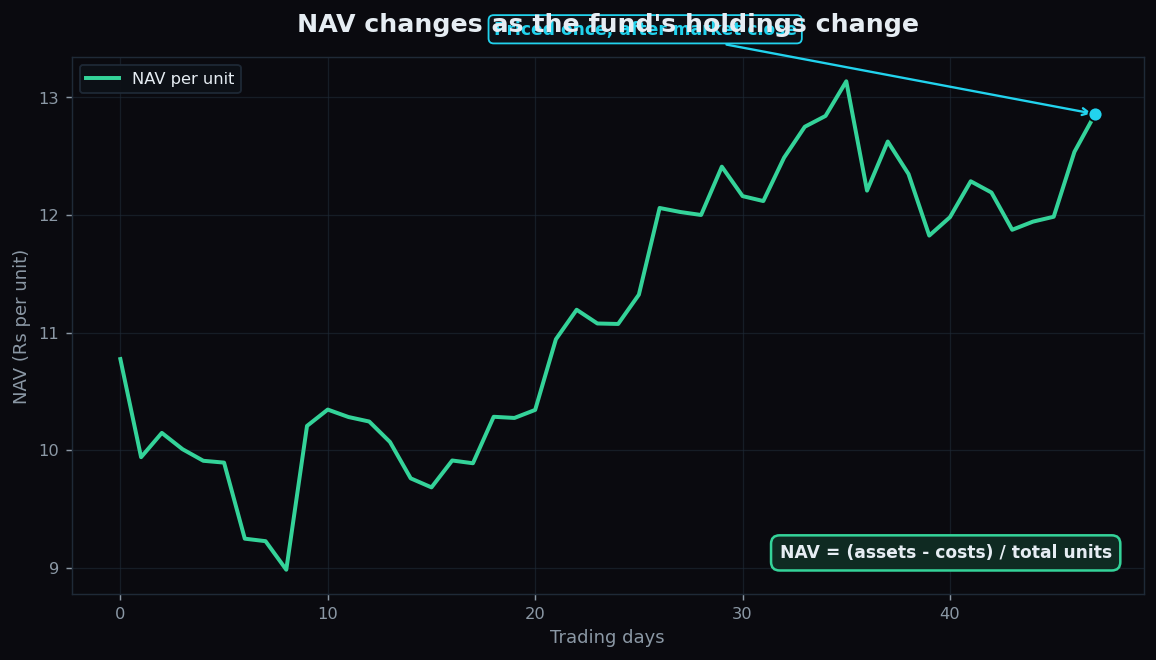
The chart above shows NAV drifting up as the fund's holdings gain value. Two things are worth understanding about how that number updates:
- NAV moves because the holdings move. As the prices of the stocks and bonds inside the fund change through the day, the total value of the pool changes, and so does NAV per unit.
- NAV is calculated once a day, after market close. Unlike a stock or an ETF that has a live price all day, a traditional mutual fund is priced a single time each trading day, once the closing prices of its holdings are known. Whether you invest at 10 a.m. or 2 p.m., you get that day's end-of-day NAV.
This once-a-day pricing is the biggest practical contrast with an exchange traded fund (ETF), which trades continuously at live prices. Same idea of a pooled basket — different pricing rhythm.
Why NAV matters — and the honest catch
NAV matters because it is how your investment is measured: your holding's worth is simply your number of units multiplied by the current NAV. It is also how buying and selling are priced — you receive units based on the NAV on the day you invest, and you redeem at the NAV on the day you exit.
But here is the catch that confuses almost every beginner: a low NAV is not “cheap” and a high NAV is not “expensive.” The NAV number by itself tells you nothing about whether a fund is a good or bad holding.
- A fund with a NAV of Rs 15 that grows 10% becomes Rs 16.50.
- A fund with a NAV of Rs 150 that grows 10% becomes Rs 165.
- Both investors earned exactly 10%. The starting NAV was irrelevant to the return.
A high NAV usually just means the fund has existed longer or grown for years. What actually matters is the percentage change in NAV over time, the fund's costs, its risk, and how it fits your own goals — not the raw price of a single unit. Chasing a “low NAV” because it looks affordable is one of the most common beginner errors.
A second honest point: NAV rising is never guaranteed. The pool holds real assets whose prices fall as well as rise, so NAV can drop, sometimes sharply. Past increases do not promise future ones. Everything here is educational, describing how the mechanism works — not advice to invest in any particular fund.
Seeing past a single headline number — like NAV — to the structure and behaviour underneath is the habit that separates informed investors from confused ones. TrueTrend is built to teach exactly that kind of clear, structural thinking. You can create a free account to explore market concepts at your own pace, with no tips and no pressure.
Key takeaways
- A mutual fund pools money from many investors and a manager invests it as one basket; you own units, not individual shares.
- NAV (Net Asset Value) is the value of one unit: total holdings minus costs, divided by the number of units.
- NAV changes as the fund's holdings change and is priced once a day after market close — unlike an ETF's live intraday price.
- A low NAV is not cheap and a high NAV is not expensive; only the percentage change over time, costs, and risk matter.
- NAV can fall as well as rise — nothing here is a guarantee or a recommendation, just how the mechanism works.
See these concepts on live market data — free
Create a free TrueTrend account to watch daily support/resistance levels, market regime, and option-positioning charts on NIFTY, BankNifty and 12 more instruments. Every level we publish is scored on a public scoreboard — misses included. No card required.
Free forever tier · daily levels with published hit-rates across every instrument. Descriptive market structure, not investment advice.
Not ready for an account? Get the daily levels by email.
One short email each market day — the indices' call wall, put wall, gamma flip and max pain, and how the last session's levels scored. Free, no account, unsubscribe anytime.
Descriptive market structure, not investment advice. We never share your email.