Open Interest vs Volume: What's the Real Difference?
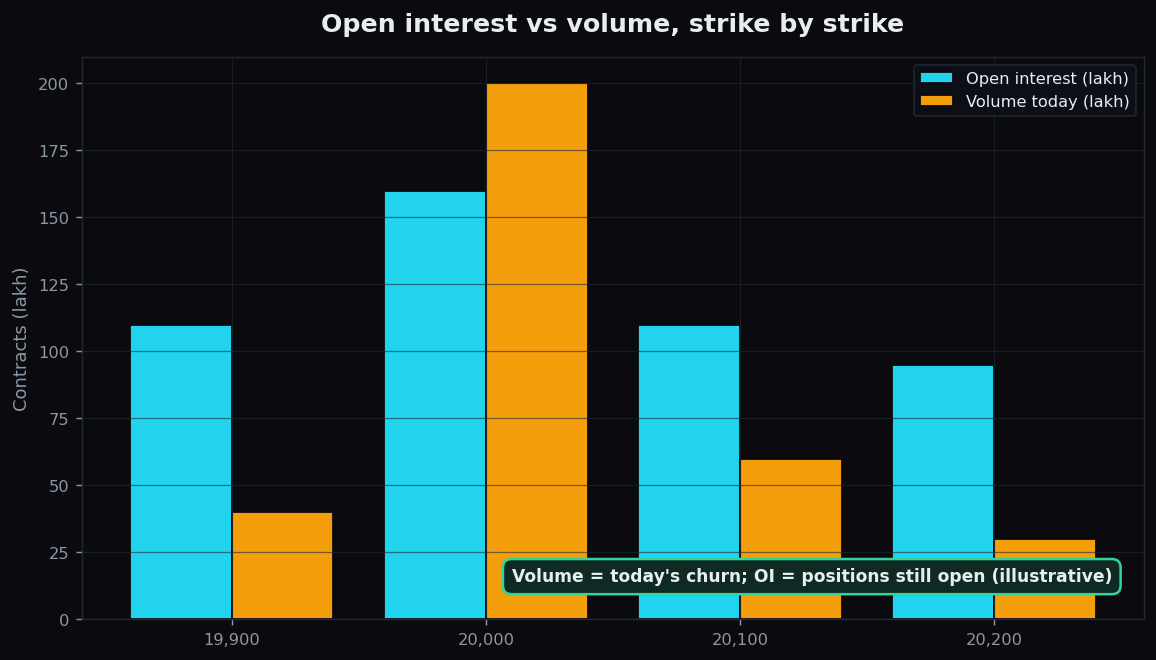
Two numbers on an option chain get mixed up more than any others: open interest and volume. They sound similar, they sit side by side, and both go up when a strike gets busy. But they measure different things — and knowing the difference changes how you read the whole chain.
The one-line difference
Volume counts how many contracts traded during the current session. It resets to zero at the start of every day. Open interest, or OI, counts how many contracts are still open and have not been closed out. It carries over from day to day. Volume is a flow; OI is a level.
Here is an everyday analogy. Think of a car park. Volume is the number of cars that drove through the gate today — every entry and every exit clicks the counter. Open interest is the number of cars actually parked in the lot right now. A car can drive in and drive out on the same day, adding two to the day's traffic count while leaving the number of parked cars unchanged.
How each one changes on a single trade
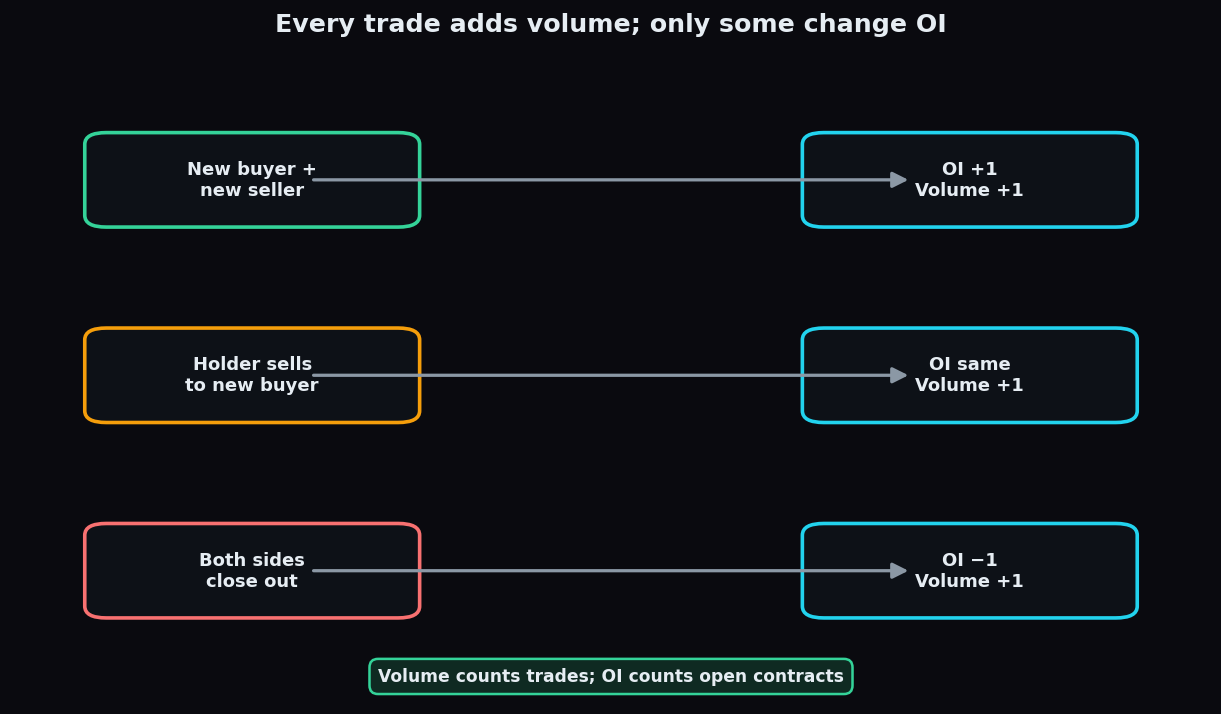
Every option trade needs a buyer and a seller. What happens to OI depends on whether each side is opening a new position or closing an existing one. Volume, by contrast, always ticks up by one for the trade. Three cases cover it:
- A new buyer meets a new seller. A fresh contract is created. OI rises by one; volume rises by one.
- An existing holder sells to a new buyer. The contract just changes hands. OI stays the same; volume still rises by one.
- Both sides are closing out. A holder and a writer both exit the same contract. OI falls by one; volume rises by one.
Notice that volume goes up in all three cases, while OI can go up, stay flat, or go down. That is why a strike can post huge volume on a quiet OI — lots of churn, few new positions.
A worked example
Take the 20,000 strike on a synthetic chain. At the open it carries OI of 150 lakh and, of course, zero volume for the day. During the session:
- 60 lakh contracts trade where both sides are opening new positions. OI climbs by 60 to 210; volume is now 60.
- Another 100 lakh trade where holders simply pass contracts to new buyers. OI is unchanged at 210; volume rises to 160.
- Finally 40 lakh trade where both sides close out. OI drops by 40 to 170; volume ends at 200.
End of day: volume 200 lakh, OI 170 lakh. The strike looked extremely active, yet net open positions barely moved from where they started. Reading volume alone would have badly overstated how much fresh commitment showed up.
Why the distinction matters
Because they answer different questions. Volume tells you how tradable a strike is right now — high volume usually means tighter pricing and easier entry and exit. OI tells you how much open commitment is stacked at a strike over time. Market watchers often pair them: rising OI alongside rising volume is described as fresh positions building, while high volume with falling OI is described as positions being unwound. For a deeper look at what those open positions represent, see our explainer on open interest and why it matters.
The honest catch
Neither number is a crystal ball. OI is reported with a lag and is often finalised only after the session, so intraday OI figures are estimates. Both numbers describe what already happened, not what comes next. A jump in OI does not tell you which side — the buyer or the seller — is the informed one; it only says a contract stayed open. And large OI at a strike is routinely read as a firm support or resistance level, a reading that fails often because positions get rolled and hedged constantly. Treat volume and OI as descriptions of activity and commitment, not as instructions.
TrueTrend surfaces OI and volume context side by side, in plain language, so beginners can see the difference at a glance. Create a free account to explore it.
Key takeaways
- Volume = contracts traded today; it resets daily. Open interest = contracts still open; it carries over.
- Analogy: volume is cars through the gate today; OI is cars parked in the lot right now.
- Every trade adds to volume, but OI only rises when both sides open, stays flat on a transfer, and falls when both sides close.
- High volume with flat OI means lots of churn but little fresh commitment, as in the worked example.
- Both are lagging descriptions of activity, not forecasts — intraday OI is only an estimate.
See these concepts on live market data — free
Create a free TrueTrend account to watch daily support/resistance levels, market regime, and option-positioning charts on NIFTY, BankNifty and 12 more instruments. Every level we publish is scored on a public scoreboard — misses included. No card required.
Free forever tier · daily levels with published hit-rates across every instrument. Descriptive market structure, not investment advice.
Not ready for an account? Get the daily levels by email.
One short email each market day — the indices' call wall, put wall, gamma flip and max pain, and how the last session's levels scored. Free, no account, unsubscribe anytime.
Descriptive market structure, not investment advice. We never share your email.