Option Delta Explained Simply: Premium Speed & Probability
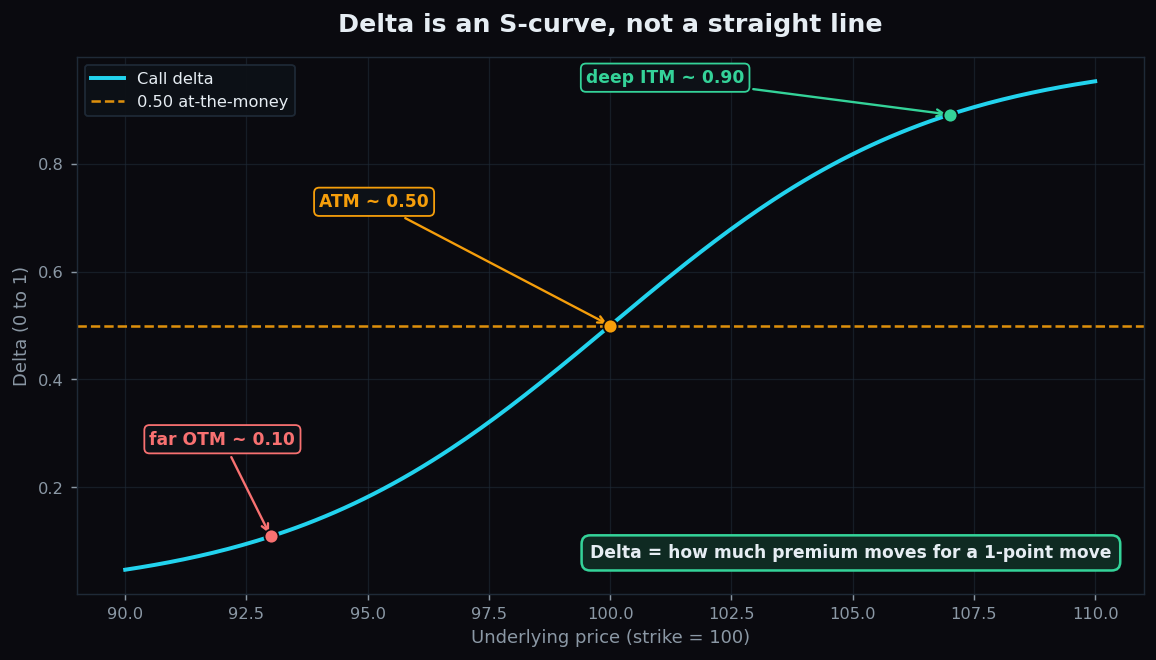
If you have ever bought an option and watched it barely move while the stock jumped, or rocket when the index nudged just a little, you have already met delta. Delta is the first and most important of the option Greeks — the numbers that measure how an option’s price reacts to the world around it. Think of delta as the option’s speed: how fast its premium moves when the underlying moves.
What delta actually measures
Delta is the sensitivity of an option’s premium to a 1-point move in the underlying. The underlying is the thing the option is built on — a stock, or an index like Nifty. If a call option has a delta of 0.40, then for every 1 point the underlying rises, the call’s premium tends to rise by about 0.40 points. If the underlying falls 1 point, the premium tends to fall about 0.40.
A few ground rules:
- Call deltas run from 0 to +1. Calls gain when the underlying rises, so their delta is positive.
- Put deltas run from 0 to −1. Puts gain when the underlying falls, so their delta is negative.
- At-the-money (ATM) options — strike near the current price — sit around 0.50 (or −0.50 for puts).
- Deep in-the-money (ITM) options approach 1 (or −1): they move almost point-for-point with the underlying.
- Far out-of-the-money (OTM) options approach 0: they barely twitch.
Notice the shape above. Delta is not a straight line. It is an S-curve. Near the strike, delta changes quickly; far above or below, it flattens out. That curve is the whole personality of an option, and it explains a lot of the surprises beginners run into.
The speed analogy
Picture your option as a car and the underlying as the road. Delta is the speedometer reading — how many points of premium you cover for each point the road moves. A deep-ITM option is a car already cruising at full speed: the road moves, you move right along with it (delta near 1). A far-OTM option is a car barely idling: the road moves and you hardly budge (delta near 0). An ATM option is accelerating through the middle gears (delta near 0.50), and this is where the speed changes most dramatically — a theme we pick up when we discuss gamma, the acceleration.
Why delta matters
Delta does three useful jobs at once.
1. It tells you your exposure. A single Nifty option with delta 0.50 behaves, for small moves, like holding half a unit of Nifty. Traders call this “50 deltas”. If you hold five such calls, you carry roughly 250 deltas of directional exposure — the same first-order sensitivity as 2.5 units of the index. This is how desks measure how exposed they are without staring at every individual contract.
2. It gives a rough probability intuition. Here is a handy — if imperfect — mental shortcut: an option’s delta is loosely the market’s implied chance that it finishes in-the-money at expiry. A 0.30-delta call behaves as if it has about a 30% chance of expiring with value; a 0.50-delta ATM option sits near a coin flip. It is an approximation, not a guarantee, but it helps you read the option chain like a probability map rather than a price list.
3. It lets you compare and combine positions. Because deltas add up, you can sum the deltas of every leg in a strategy to see your net direction. A position that nets to zero delta is “delta-neutral” — balanced against small moves in either direction.
A worked example with round numbers
Suppose an index is trading at 20,000. You are looking at a call with a strike of 20,000 (at-the-money), priced at a premium of 150, with a delta of 0.50.
- The index rises 20 points to 20,020. Expected premium change ≈ 20 × 0.50 = 10. New premium ≈ 160.
- The index falls 20 points to 19,980. Expected premium change ≈ −10. New premium ≈ 140.
Now compare a far-OTM call at strike 20,400 with a delta of just 0.10. The same 20-point rise lifts its premium only about 20 × 0.10 = 2. Same market move, very different reaction — purely because of delta. This is why a beginner can be “right” on direction and still watch a cheap OTM option do almost nothing.
Delta is the slope of the payoff line
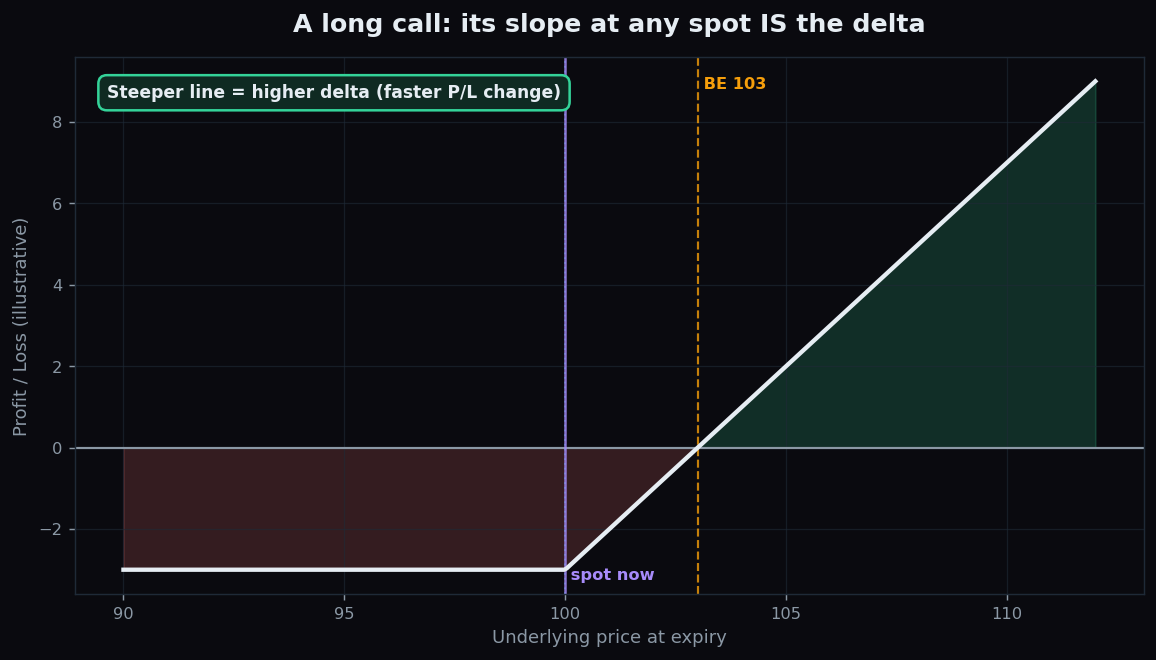
There is an elegant way to see delta. Plot an option’s value against the underlying price and look at the slope of that line at any point. That slope is the delta. Where the payoff line is flat (far OTM), delta is near 0. Where it rises steeply (deep ITM), delta is near 1. The ATM region is the bend in between, where the slope is changing fastest. Delta is simply how steep your option is right now.
The honest catch
Delta is powerful but it has real limits, and pretending otherwise costs beginners money.
- Delta itself keeps changing. The 0.50 you see now is a snapshot. As the underlying moves, delta slides along the S-curve. For a big move, multiplying by today’s delta will under- or over-estimate the result. The rate at which delta changes has its own Greek — gamma.
- Delta only describes the price move. It says nothing about the premium you lose to the passage of time (theta) or to a drop in implied volatility (vega). An option can have a healthy delta and still lose money because volatility collapsed — the trap we cover in why an option can lose value even when you were right.
- The probability reading is approximate. Delta leans on volatility assumptions and is not a clean statistical probability. Treat it as a rough gauge, not a forecast.
Want to see how option structure and market context line up over time, without the jargon? TrueTrend turns the option chain and positioning data into plain-English context for learners. Explore the public TrueTrend scoreboard to see how we track market structure transparently.
Key takeaways
- Delta = speed: how much an option’s premium moves for a 1-point move in the underlying.
- Calls have delta 0 to +1; puts have delta 0 to −1; at-the-money sits near 0.50.
- Delta follows an S-curve — it is the slope of the option’s payoff line, and it changes as price moves.
- Delta doubles as a rough probability of finishing in-the-money — useful, but only an approximation.
- Delta ignores time decay and volatility; it is one Greek among several, never the whole story.
See these concepts on live market data — free
Create a free TrueTrend account to watch daily support/resistance levels, market regime, and option-positioning charts on NIFTY, BankNifty and 12 more instruments. Every level we publish is scored on a public scoreboard — misses included. No card required.
Free forever tier · daily levels with published hit-rates across every instrument. Descriptive market structure, not investment advice.
Not ready for an account? Get the daily levels by email.
One short email each market day — the indices' call wall, put wall, gamma flip and max pain, and how the last session's levels scored. Free, no account, unsubscribe anytime.
Descriptive market structure, not investment advice. We never share your email.