Option Gamma Explained: The Acceleration Behind Delta
In our look at option delta, we called delta the option’s speed — how fast its premium moves when the underlying moves. But speed is only half the story. Anyone who has driven a car knows that what really throws you around is not speed itself, but how quickly the speed changes. That is acceleration. In the world of options, acceleration has a name: gamma.
What gamma actually measures
Gamma is the rate of change of delta. Where delta tells you how much the premium moves for a 1-point move in the underlying, gamma tells you how much the delta itself changes for that same 1-point move. If a call has a delta of 0.50 and a gamma of 0.04, then a 1-point rise pushes delta from 0.50 to about 0.54; a 1-point fall pushes it down to about 0.46.
Two layers, stacked:
- Delta answers: how fast is my premium moving right now?
- Gamma answers: how fast is that speed changing?
That is exactly the speed-and-acceleration relationship. Delta is the speedometer; gamma is the push you feel in your seat when the car speeds up or slows down.
Why gamma peaks at-the-money
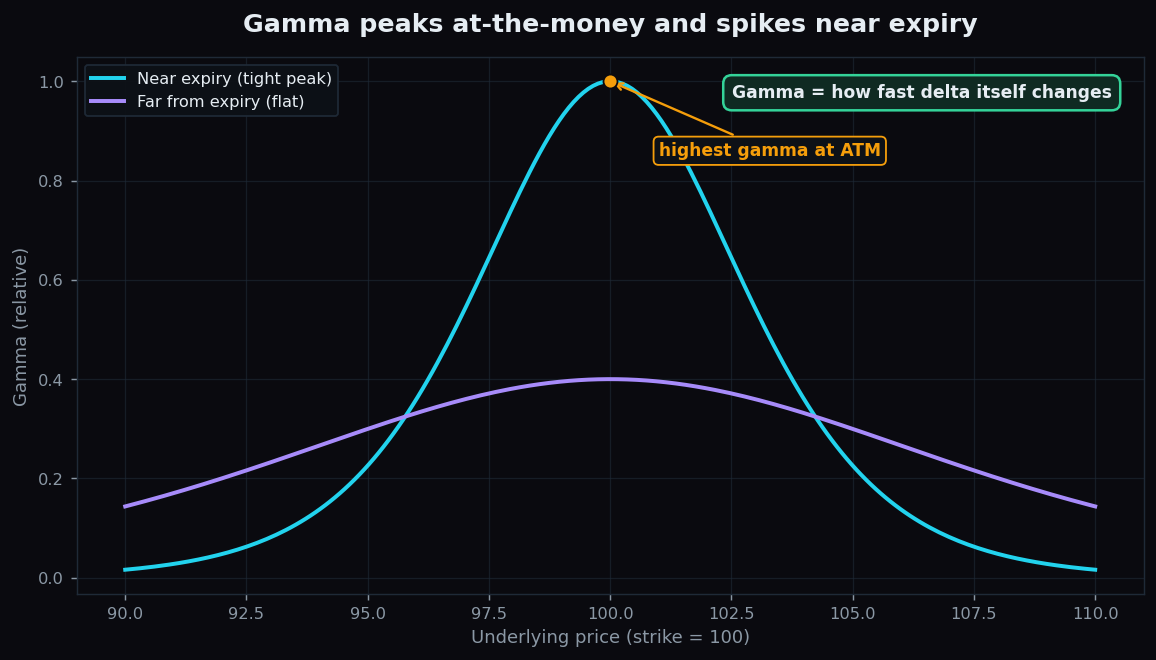
Recall that delta is an S-curve. Far out-of-the-money, the curve is almost flat — delta is near 0 and barely changes, so gamma is tiny. Deep in-the-money, the curve is flat again near the top — delta is near 1 and barely changes, so gamma is tiny once more. The steepest part of the S-curve is in the middle, at-the-money (ATM), where a small move in the underlying flips delta the most. That steepest stretch is where gamma is highest.
So gamma forms a hump: low on both wings, tall in the centre. The strike where the option is at-the-money is the peak of the hump. This is why ATM options feel the most “alive” — their direction sensitivity is changing the fastest.
Why gamma spikes near expiry
Now add time. Far from expiry, there is plenty of time for the underlying to wander, so the delta S-curve is gentle and gamma is spread thin across many strikes. As expiry approaches, the S-curve sharpens into almost a step: just below the strike the option will likely expire worthless (delta heading to 0), just above it the option will likely expire in-the-money (delta heading to 1). That near-vertical flip means delta changes enormously over a tiny price range — gamma explodes right around the strike in the final days.
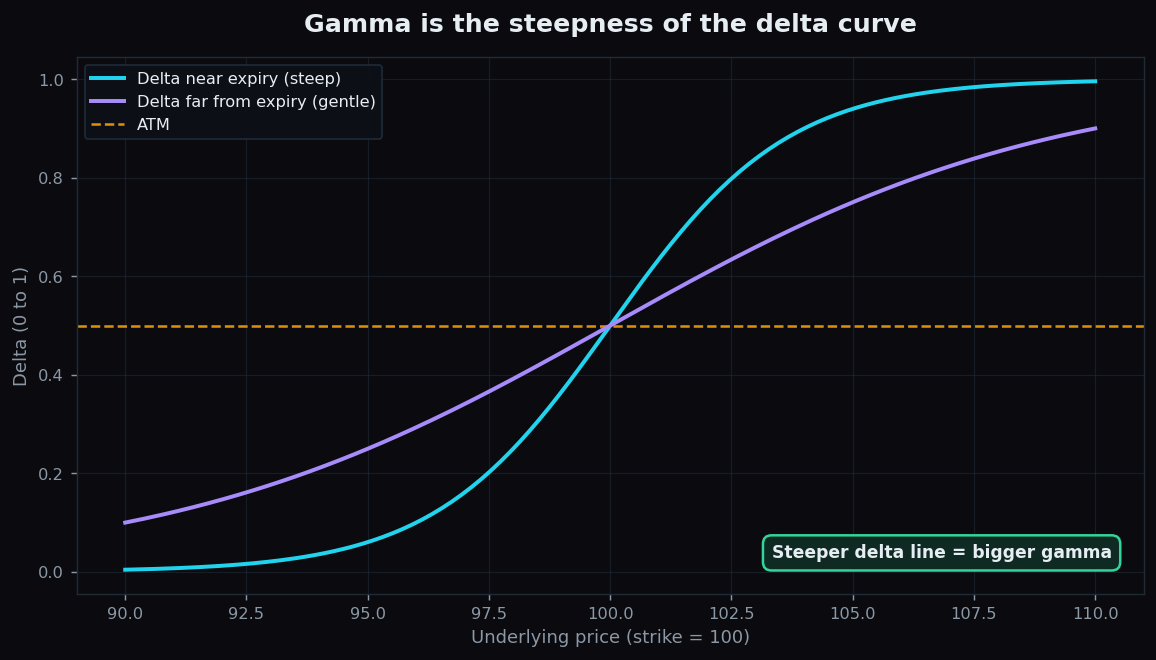
The chart above makes the link visual: gamma is simply the steepness of the delta line. The steep near-expiry delta curve has high gamma; the gentle far-from-expiry curve has low gamma. Same option, very different gamma, just because of time left.
The acceleration analogy in one line
If delta is the speedometer, gamma is the accelerator pedal. A high-gamma option is twitchy — press the market a little and its speed (delta) lurches. A low-gamma option is sluggish — you can push it and the speed hardly changes. Knowing gamma tells you how surprised you can expect to be.
A worked example with round numbers
Suppose an index is at 20,000 and you hold an at-the-money call with delta 0.50 and gamma 0.05 (gamma of 0.05 means delta changes by 0.05 for each 100-point move, to keep the numbers clean).
- The index rises 100 points to 20,100. Delta climbs by about 0.05, from 0.50 to 0.55. Your option is now moving faster than before.
- The index rises another 100 points to 20,200. Delta climbs again toward 0.60. Each leg up, your option earns at an accelerating rate.
- The index instead falls 100 points to 19,900. Delta drops toward 0.45, so the option slows down as it loses — losses decelerate.
This is the friendly face of being long an option (a buyer): positive gamma means gains accelerate and losses decelerate. The unfriendly face belongs to the seller, who is short gamma — their losses can accelerate while their gains slow down. Same number, opposite experience.
Why gamma matters in practice
- It explains why simple delta math drifts. If you estimate an option’s move using only today’s delta, a large underlying move will fool you, because delta itself shifted along the way. Gamma is the correction term.
- It flags where positions get unstable. Near expiry and near the strike, gamma is largest, so a position’s direction can swing from barely-exposed to fully-exposed within a few points. Expiry-day whipsaw is gamma at work.
- It frames the buyer-versus-seller trade-off. Option buyers pay (through time decay) for the privilege of positive gamma; sellers collect that decay in exchange for taking on negative gamma risk — the tension explored in how option sellers think.
The honest catch
- High gamma is a double-edged sword. It accelerates favourable moves, but for a seller it accelerates the damage. “High gamma” is not automatically good or bad — it depends entirely on which side you are on.
- Gamma and time decay are linked. The very options with the juiciest gamma (ATM, near expiry) also bleed the most time value. You rarely get acceleration for free; you pay for it in theta, the subject worth studying next.
- Gamma is itself a snapshot. Like delta, it changes as price, time, and volatility shift. It is a guide to behaviour over small moves, not a fixed property.
Curious how option positioning shifts as expiry approaches, explained for learners rather than insiders? TrueTrend translates the option chain into plain-English market context. Create a free TrueTrend account to follow along.
Key takeaways
- Gamma = acceleration: the rate at which delta changes for a 1-point move in the underlying.
- Gamma peaks at-the-money, where the delta S-curve is steepest, and fades far ITM or far OTM.
- Gamma spikes near expiry as the delta curve sharpens into a near-vertical step around the strike.
- Option buyers are long gamma (gains accelerate, losses decelerate); sellers are short gamma (the reverse).
- Gamma is the reason delta-only estimates drift on big moves — it is the correction term, not the whole answer.
See these concepts on live market data — free
Create a free TrueTrend account to watch daily support/resistance levels, market regime, and option-positioning charts on NIFTY, BankNifty and 12 more instruments. Every level we publish is scored on a public scoreboard — misses included. No card required.
Free forever tier · daily levels with published hit-rates across every instrument. Descriptive market structure, not investment advice.
Not ready for an account? Get the daily levels by email.
One short email each market day — the indices' call wall, put wall, gamma flip and max pain, and how the last session's levels scored. Free, no account, unsubscribe anytime.
Descriptive market structure, not investment advice. We never share your email.