Option Vega: Sensitivity to Volatility, Explained Simply
Two traders hold the exact same option, at the same strike, with the same time to expiry, on a day the underlying barely moves. One ends the day up, the other down. How? The answer is usually vega — the option Greek that measures how much a premium moves when implied volatility changes. If delta reacts to price and theta reacts to time, vega reacts to the market’s mood about how wild things might get.
What vega actually measures
Vega is the sensitivity of an option’s premium to a 1 percentage-point change in implied volatility. Implied volatility (IV) is the market’s estimate of how much the underlying might swing in the future, expressed as an annualised percentage and baked into the option’s price. A vega of 5 means that if IV rises by 1 percentage point — say from 20% to 21% — the premium rises by about 5, with the underlying price unchanged. If IV falls 1 point, the premium falls about 5.
Note the direction: both calls and puts gain value when IV rises. More expected movement means more chance the option finishes deep in the money, so the option is worth more. Vega is positive for option buyers and negative for sellers.
The weather analogy
Think of implied volatility as the forecast and vega as how sensitive your plans are to that forecast. An option is like an umbrella. If the forecast calls for storms (high IV), umbrellas are in demand and their price rises — even if it has not started raining yet. If the forecast calms to clear skies (low IV), umbrella prices sag, again before a single drop falls or fails to fall. Vega measures how much your umbrella’s price reacts to the changing forecast, separate from whether it actually rains (the price move) or how late in the day it is (time decay).
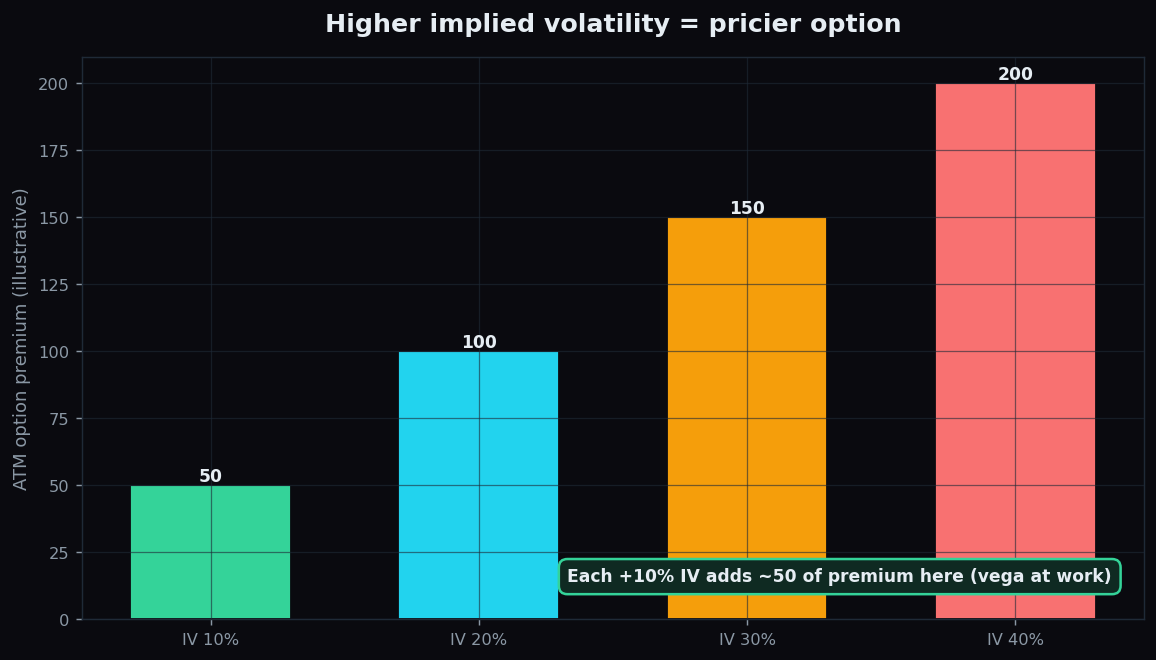
The bars above show the core idea. Hold the strike, the underlying, and the time to expiry fixed, and just change the implied volatility. The premium climbs steadily as IV rises. Here, each extra 10 points of IV adds about 50 of premium — that steady step is vega doing its work.
A worked example with round numbers
Suppose an index is at 20,000 and you purchase an at-the-money call. Today implied volatility is 20%, the premium is 100, and the option’s vega is 5.
- A big event tomorrow makes the market nervous and IV jumps to 25%. That is +5 IV points. Expected premium change ≈ 5 × 5 = +25. The premium rises to about 125 — even if the index has not moved at all.
- The event passes uneventfully and IV collapses back to 18%. That is −2 IV points from the original. Expected change ≈ 5 × (−2) = −10. The premium sags toward 90.
This is how you can be right on direction and still lose: you bought when the forecast was stormy (high IV) and the storm fizzled, so the umbrella lost value. That collapse is so common around results and big events that it has its own name — explored in why an option can lose value even when you were right.
Where vega is largest
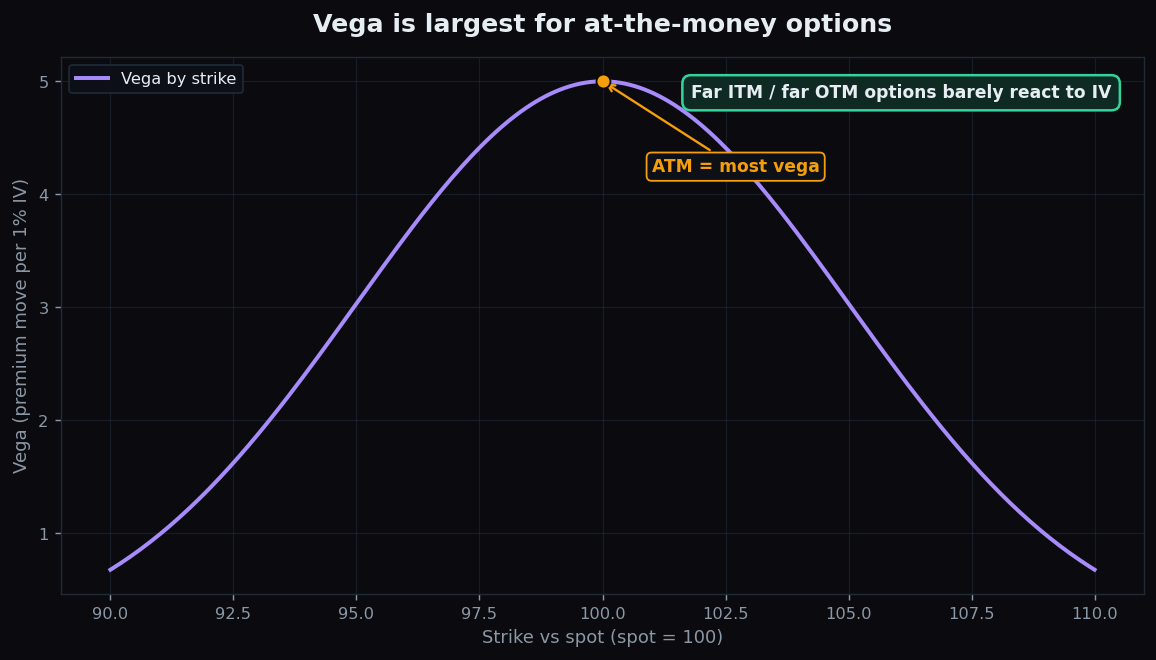
Vega is not the same for every option. Like gamma, it peaks for at-the-money options and fades as you move far in- or out-of-the-money. The reason is intuitive: a change in expected swing matters most for an option sitting right on the fence, where extra volatility could push it either way. A far-OTM option is a long shot regardless, and a deep-ITM option is nearly settled regardless, so changing the forecast moves their prices less.
Two other rules of thumb:
- More time to expiry means more vega. A longer-dated option has more future for volatility to act on, so it is more sensitive to the forecast. Near-expiry options have low vega — there is little future left to revalue.
- Vega and theta often pull against each other. The longer-dated options richest in vega also decay slowly; the near-expiry options that decay fast carry little vega. You are usually trading one sensitivity for another.
Why vega matters
- It explains “flat market, moving premium”. When the underlying is quiet but your option still swings, vega (a shift in IV) is the usual suspect.
- It is the heart of event trading. Implied volatility tends to build up before scheduled events — results, policy decisions, budgets — and deflate afterward. Buyers who ignore vega often overpay into the event and watch the air come out the next day.
- It reframes what you are really betting on. Buying an option is not only a bet on direction; it is partly a bet that volatility will rise or at least hold. Selling an option is partly a bet that volatility will fall or stay calm.
The honest catch
- Vega is a first-order estimate. Multiplying vega by the IV change works well for small shifts. For large jumps in volatility, the relationship bends and the simple estimate drifts.
- IV can move independently of price. Implied volatility has a mind of its own — it can rise while the market is calm or fall during a move. You cannot fully predict the “forecast”, only respect that it changes.
- High IV is not automatically “good”. A high vega in a high-IV environment means there is a lot of room for IV to fall, which hurts buyers. Context matters more than the raw number.
- Vega never travels alone. A real position is exposed to delta, gamma, theta, and vega all at once. Studying one Greek in isolation builds intuition; trading ignores the others at your peril.
Want to see how implied volatility and option positioning shift around big events — explained for learners, not insiders? TrueTrend turns the option chain into plain-English market context. Create a free TrueTrend account to keep learning.
Key takeaways
- Vega = sensitivity to the volatility weather: how much premium moves for a 1-point change in implied volatility.
- Both calls and puts gain when IV rises; buyers are long vega, sellers are short vega.
- Vega is largest for at-the-money and longer-dated options; it fades near expiry and far from the strike.
- You can be right on direction and still lose if you bought into high IV that then collapsed.
- Vega is one Greek among several — a first-order guide that always shares the stage with delta, gamma, and theta.
See these concepts on live market data — free
Create a free TrueTrend account to watch daily support/resistance levels, market regime, and option-positioning charts on NIFTY, BankNifty and 12 more instruments. Every level we publish is scored on a public scoreboard — misses included. No card required.
Free forever tier · daily levels with published hit-rates across every instrument. Descriptive market structure, not investment advice.
Not ready for an account? Get the daily levels by email.
One short email each market day — the indices' call wall, put wall, gamma flip and max pain, and how the last session's levels scored. Free, no account, unsubscribe anytime.
Descriptive market structure, not investment advice. We never share your email.